
Flamegraphing your way out of "this can't possibly be right"
I was two days into sketching a Controller architecture for the mesh. The reasoning went: 18 nodes at 35% host CPU after the obvious wins meant iroh-gossip itself was just expensive, the architecture was wrong, and the right move was a hub-and-spoke pattern with a coordinator that every node holds one connection to. A central sequencer instead of a peer-to-peer swarm. The model that's supposed to be the safe choice.
Halfway through the spike I noticed I hadn't actually profiled anything. The case for the Controller rewrite was built on a measurement gap, not a measurement. I closed the editor, added tracing-flame = "0.2.0" to the workspace, captured 15 seconds of flame data, and rendered it.
The graph was lopsided in a way that didn't fit my model.
What the flamegraph said
The dominant function in every node's CPU profile was iroh::endpoint::connect. Not Plumtree dissemination. Not packet decode. Not OTLP export. The thing every node was spending most of its time on was opening QUIC connections — at thousands of calls per second, on an 18-node cluster where nothing was disconnecting.
That should not be happening at all.
I went looking for who was calling endpoint.connect() in the hot path. The chain led to a sender.join_peers(peer_ids) call inside run_gossip's 100ms tick loop. There was a comment right next to it claiming:
// Feed mdns-discovered peers to gossip so the swarm forms.
// join_peers is idempotent — calling every tick with the current peer
// registry is cheap.
The comment had two correct words and one fatal one. "Idempotent" was true — calling join_peers with the same set of peers leaves the gossip state unchanged. "Cheap" was a lie. Idempotent in outcome says nothing about cost: under the hood, iroh interprets each call as "establish a transport connection to each of these peers," which kicks off a fresh TLS 1.3 handshake on top of QUIC's 1-RTT setup. Every time. For every peer. On a 100ms timer.
At 18 nodes with ~5 peers each in the active view: 18 × 5 × 10/sec = 900 handshake attempts per second per node, 3,240 cluster-wide. All landing on already-established connections that didn't need re-establishing. All doing exactly nothing useful for the gossip protocol.
The fix
A HashSet<String> of peers I've already told gossip about. Only call join_peers for entries that aren't in the set.
let mut joined_peers = HashSet::new();
loop {
    tokio::select! {
        _ = tick.tick() => {
            let mut new_peers = Vec::new();
            for peer in registry.iter() {
                if !joined_peers.contains(peer.key()) {
                    if let Ok(id) = iroh::EndpointId::from_str(peer.key()) {
                        new_peers.push(id);
                        joined_peers.insert(peer.key().clone());
                    }
                }
            }
            if !new_peers.is_empty() {
                let _ = sender.join_peers(new_peers).await;
            }
            // …rest of gossip emit loop
        }
    }
}
One commit. Rebuild. Re-canary.
Host CPU dropped from 35% to 6%. Per-node steady-state dropped to 0.05–0.10 cores. The mesh kept gossiping, the topology view kept painting, 19/19 stayed live. The Controller rewrite I'd been sketching became unnecessary in the time it took the canary to settle.
Four more bugs in the same pass
While I was in there, the flamegraph and the diff surfaced four more:
Ghost tasks under #[instrument] on infinite loops. Two background loops (run_ping_sender, watch_mdns) were decorated with #[instrument(skip_all)]. On a normal short-lived async function, that creates a span that closes when the function returns. On an infinite loop, the root span never closes, and every event inside it gets appended to the span's child-event queue forever. OpenTelemetry's batch processor walks that queue on every export tick — over time, the walk is the cost. Removed the #[instrument] macros from the loop functions. Their inner spans still exist.
A busy-wait on a closed channel. Inside another tokio::select!, when the gossip event channel closed, the arm did continue — which made the task immediately re-poll, which immediately yielded None again, on a tight loop with no yield point. Changed to break. The task exits cleanly on channel close instead of spinning at 100% of one core.
Ghost QUIC connections on peer reconnect. When a peer disconnects and reconnects with the same identity, reg.insert(peer_id, new_conn) overwrites the registry entry without closing the previous Connection. iroh-quinn allows multiple parallel connections from the same identity, so the old one just sits there alive. The run_frame_reader and run_bi_echo_reader tasks holding the old Connection keep parking on accept_uni() / accept_bi() forever. Over hours of churn, dozens of dead connections accumulate per node. Fix: close the old connection before overwriting.
if let Some((_, old_conn)) = reg.remove(&peer_id) {
    old_conn.close(0u32.into(), b"superseded by new connection");
}
reg.insert(peer_id.clone(), conn.clone());
Stop-removing-from-sets. joined_peers never shrank. mesh_id_registry only inserted, never removed on disconnect. Both were minor compared to the join_peers storm, but both are real leaks over a long-running cluster. Added joined_peers.retain(|p| registry.contains_key(p)) on each tick, and mesh_id_registry.remove(&peer_id_str) next to the existing registry.remove in the disconnect handler.
What I'd tell a team
- Comments lie. Flamegraphs don't. Every CPU bug I found had a comment next to it claiming the code was cheap. The comment described intent, not cost. If you're inheriting a codebase, treat every "this is cheap" comment as a hypothesis to verify.
- Don't blame the protocol before you've measured. I came within a day of forking the architecture to a Controller pattern. The reasoning was internally consistent: gossip-fanout costs grow with peer count, we have a peer-count problem, therefore replace gossip. The flamegraph showed it had nothing to do with peer count — it was a 100ms tick doing the same expensive thing repeatedly. The architecture wasn't the bug.
#[instrument]on an infinite loop is almost always wrong. Spans are scoped to function lifetime. An infinite loop's span lives forever. Use#[instrument]on the work inside the loop, not on the loop itself.- Idempotent ≠ cheap. "Calling this multiple times has the same effect" says nothing about the cost of the calls. Especially in network code —
endpoint.connect()is idempotent from the application's perspective but does a full TLS handshake every time.
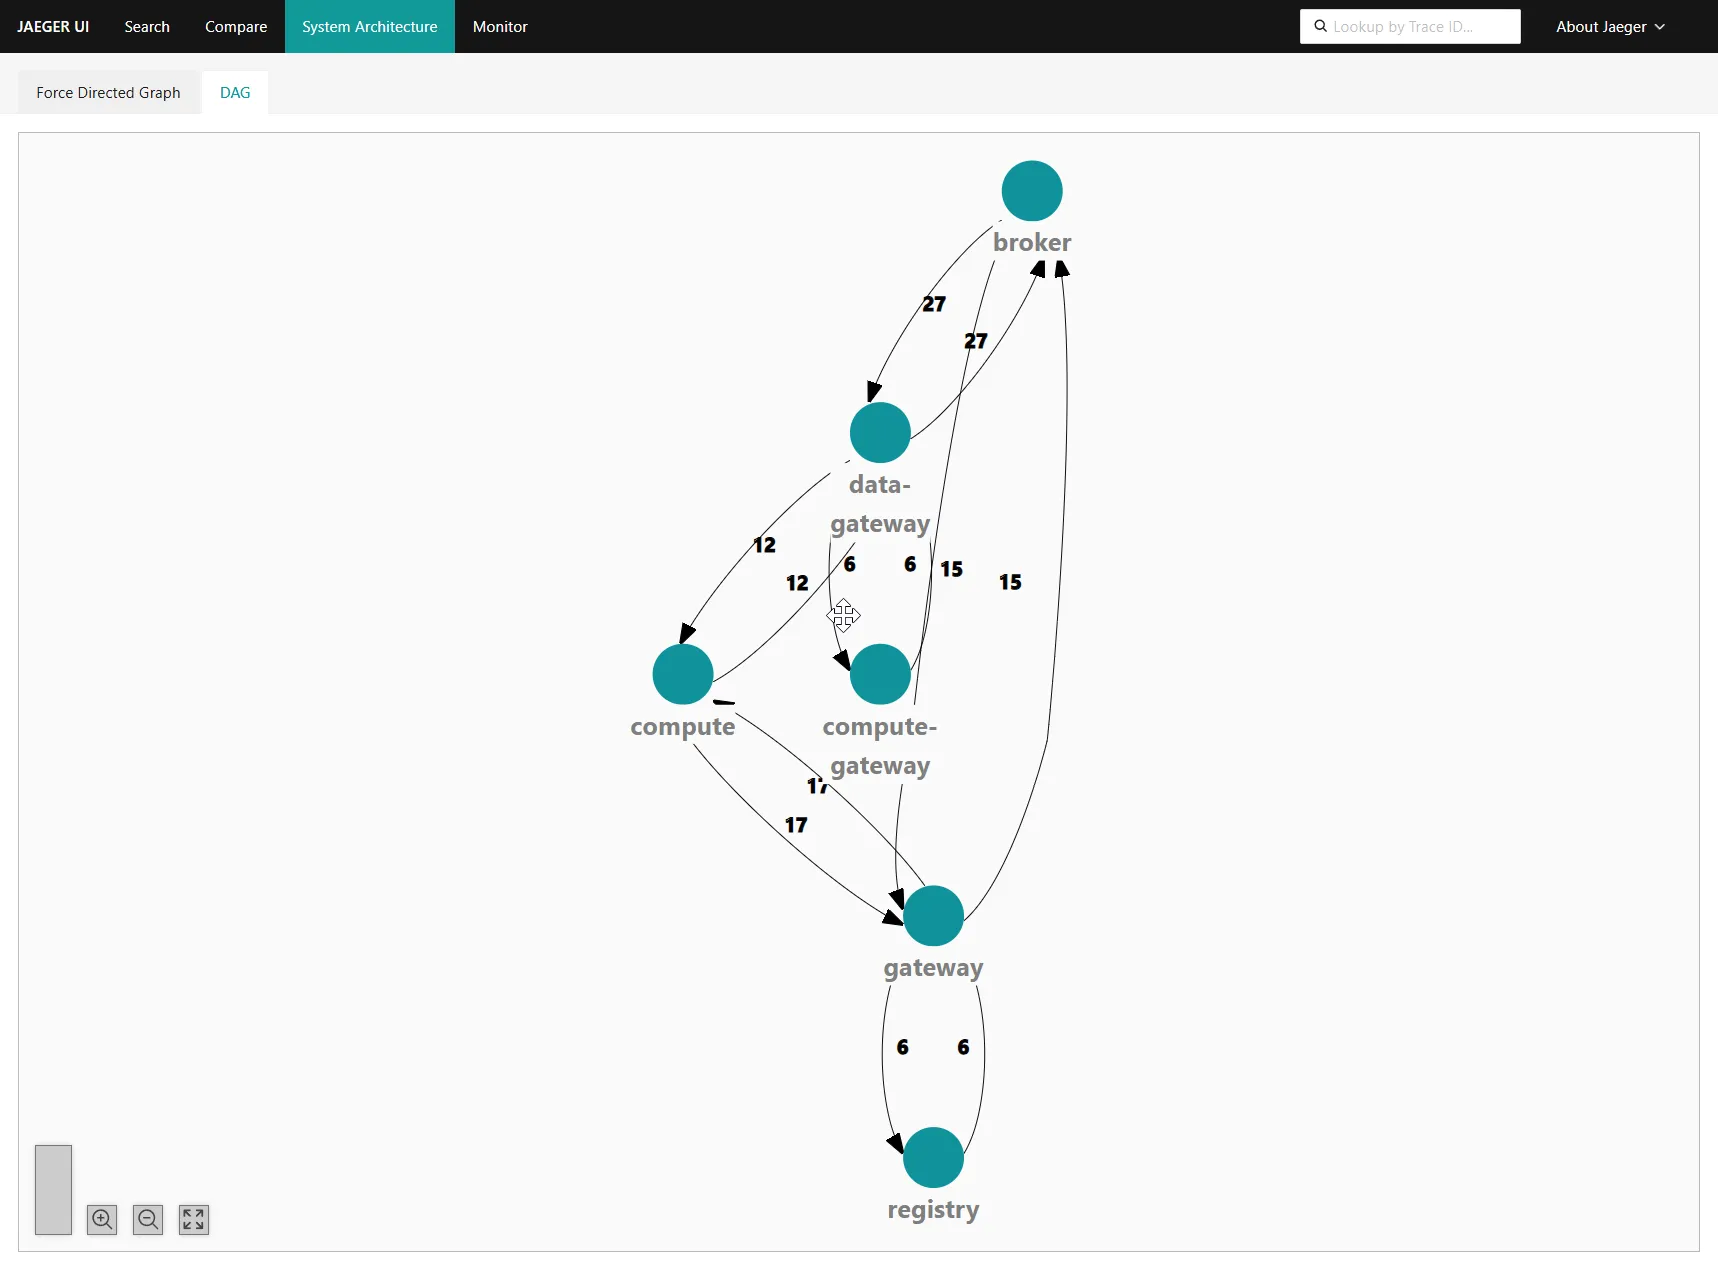
For a second-channel sanity check, the Jaeger service-architecture DAG agreed with the dashboard. Service-level call counts looked reasonable for the workload, not the four-figures-per-second I'd been seeing pre-fix:
What's next
The 6% reading held for an hour. I left it running overnight to soak. The next morning it was at 100% again.
Different bug. Slower. Worse, because it took an overnight run to surface. Next post.