 Notebook · 16 parts
 Building A Distributed Mesh in Rust
I wanted to feel where a self-organizing P2P mesh in Rust breaks before I trusted it with anything. iroh-gossip over QUIC, run small and run hard. The first 18 nodes pegged an 80-core box at 100% CPU; weeks of flamegraphs and soak tests later the same 18 idled at 5%. This notebook is the work as it happened — the wrong hypotheses, the flamegraphs, the leaks (some mine, some upstream — a churn leak I chased for two days turned into fixes across three crates), and then the harder build: a multi-mesh fabric you can actually see.
I wanted to know what it actually costs to run a self-organizing peer-to-peer mesh on commodity hardware — where it strains, where it leaks, and whether I could trust it under sustained churn. The build is Rust: an iroh-gossip layer over QUIC, nodes addressed by public key, NAT traversal handled by the fabric. I built it small — a handful of node types on one box — and ran it hard enough to break.
It broke. The first canary pegged an 80-core box at 100% CPU with 18 nodes sitting idle. Weeks of measuring, theorizing, and being wrong got it down to 5%. Most of the bugs were mine — a tokio::spawn whose task nobody owned, a DashMap that grew forever because nothing was told to prune it. But the one I chased hardest, a connection leak under sustained churn, turned out to live in the stack itself: a select! arm in the gossip layer that silently disabled itself, an address cache with no eviction, a QUIC handshake that leaked when abandoned. Two days of soak-and-profile, and the ending wasn't a workaround — it was a cluster of small fixes submitted upstream to three crates.
This notebook is the work in order, as it happened — the first canary, the flamegraph that found a self-inflicted handshake storm, four days of soak that surfaced five leaks at once, a chaos battery that replaced "tests pass," open-sourcing the result, the two-day churn-leak hunt that went upstream — and then the harder build: turning it into a multi-mesh fabric you can actually operate. Named nodes in named meshes, a gossiped topology cache, cross-mesh delivery with no bespoke bridge, a relay that carries traffic when there's no direct path, and traces honest enough to trust. Every claim in those later posts is backed by a screenshot of the live system.
 Part 01 of 16
 Why I'm building a distributed mesh substrate in Rust
Before I build anything on top of a peer-to-peer substrate, I need to know whether the substrate itself is sound. The choice is iroh-gossip over QUIC. The first canary is 18 nodes on one box. Here's what I'm trying to learn and what I expect to break.
What I'm ultimately after is an event-streaming system whose nodes can sit on different networks — different cloud regions, different colos, a laptop on a coffee-shop Wi-Fi — and form a working cluster anyway. Direct-TCP-on-a-VPC isn't enough for that. The transport layer has to handle NAT traversal, identity, mesh formation, and reconnect for me. But the streaming layer is a problem for later; first I need the substrate underneath it to be sound, and this notebook is about the substrate.
I picked iroh for the substrate. QUIC under the hood, relay tier for cross-NAT, hole-punching where it can. The application layer on top is iroh-gossip — Plumtree for eager broadcast, HyParView for membership. The combination gives me a self-organizing peer set without writing any of it myself.
The first thing I'm going to do is run 18 of these on one machine and watch what happens.
Why iroh, not direct TCP
The conventional design does the simplest thing that works: direct TCP between nodes, a metadata store like ZooKeeper or etcd, every node knowing every other by hostname. That works because the nodes live in a single network where hostnames resolve and ports are open.
The deployments I want to support don't look like that. A node behind a residential NAT. A compute box in someone's homelab. A gateway in AWS. They can't reach each other on direct TCP. They CAN reach each other via QUIC + a relay, with hole-punching closing the hop where possible. That's exactly what iroh does, and I'd rather use a maintained library than build it.
What iroh buys me concretely:
- Identity from a keypair, not a hostname. Every node has an Ed25519 keypair; the "address" is the public key. The same key from any IP works.
- NAT traversal. STUN-style probing, hole-punching, relay fallback. I don't have to think about it.
- QUIC transport. Multiplexed streams over one connection, 0-RTT reconnect, no head-of-line blocking. Better defaults than tuning TCP.
- Discovery primitives. mDNS for LAN, DHT for internet-scale. Optional and pluggable.
The cost: more bytes per packet than raw TCP (TLS 1.3 framing + QUIC headers + congestion-controller state per connection). For a substrate that's going to broadcast small heartbeats, that's the right trade.
What iroh-gossip is for, and what it isn't
iroh-gossip runs Plumtree + HyParView on top of iroh's QUIC. Plumtree forms a spanning tree across subscribed peers for eager broadcast; HyParView keeps the per-node active connection set small and roughly constant (~5–7 peers regardless of cluster size). That's how Bitcoin scales to 50,000 nodes without every node connecting to every other.
The thing I want to be careful about is what I broadcast. iroh-gossip is a control-plane primitive — it's designed for "the cluster's membership just changed" or "a new topic appeared," not "here is my full state, every two seconds, forever." Bitcoin doesn't broadcast every node's status every 2 seconds. It broadcasts transactions when they arrive. Big difference.
I have a hunch this is where I'm going to get bit. I'm setting up the gossip emit to fire on a 500ms timer with a GossipDigest that includes peer counts, frame counts, CPU/RAM. That's a lot of state on a fast clock. We'll see.
The architecture, briefly
Three layers, with deliberate separation:
| Layer | Crate | Responsibility |
|---|---|---|
| Transport | crates/mesh-transport | iroh Endpoint setup, ALPN, bind addr, mDNS toggle |
| Substrate | crates/mesh-node-base | Identity, peer registry, gossip emit loop, LoadSampler (self-reported CPU/RAM via sysinfo), staleness handling |
| Telemetry | crates/mesh-telemetry | OTLP/tracing init, every node's spans land in Jaeger |
On top, five example node types — broker, gateway, compute, registry, bridge. From the substrate's perspective they're interchangeable; the type is just a string. Each one is a 10-line main.rs that calls NodeRuntime::new("type").run().await and supplies a .env.dev preset for its CPU/RAM budget.
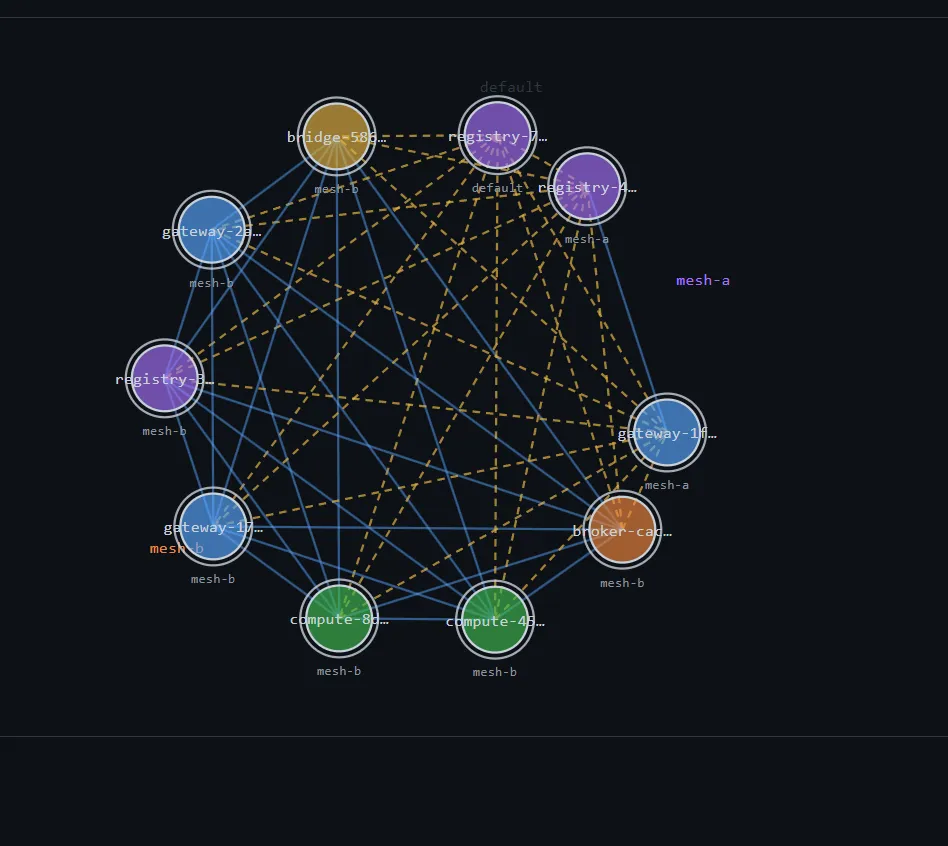
There's also an admin-ui — a React + Vite dashboard that joins the mesh as a passive observer and renders the topology live. Hub-vs-leaf is visible in the layout. Each node card shows its CPU/RAM utilization against its declared budget. That's the surface I'll use to feel what the substrate is doing.
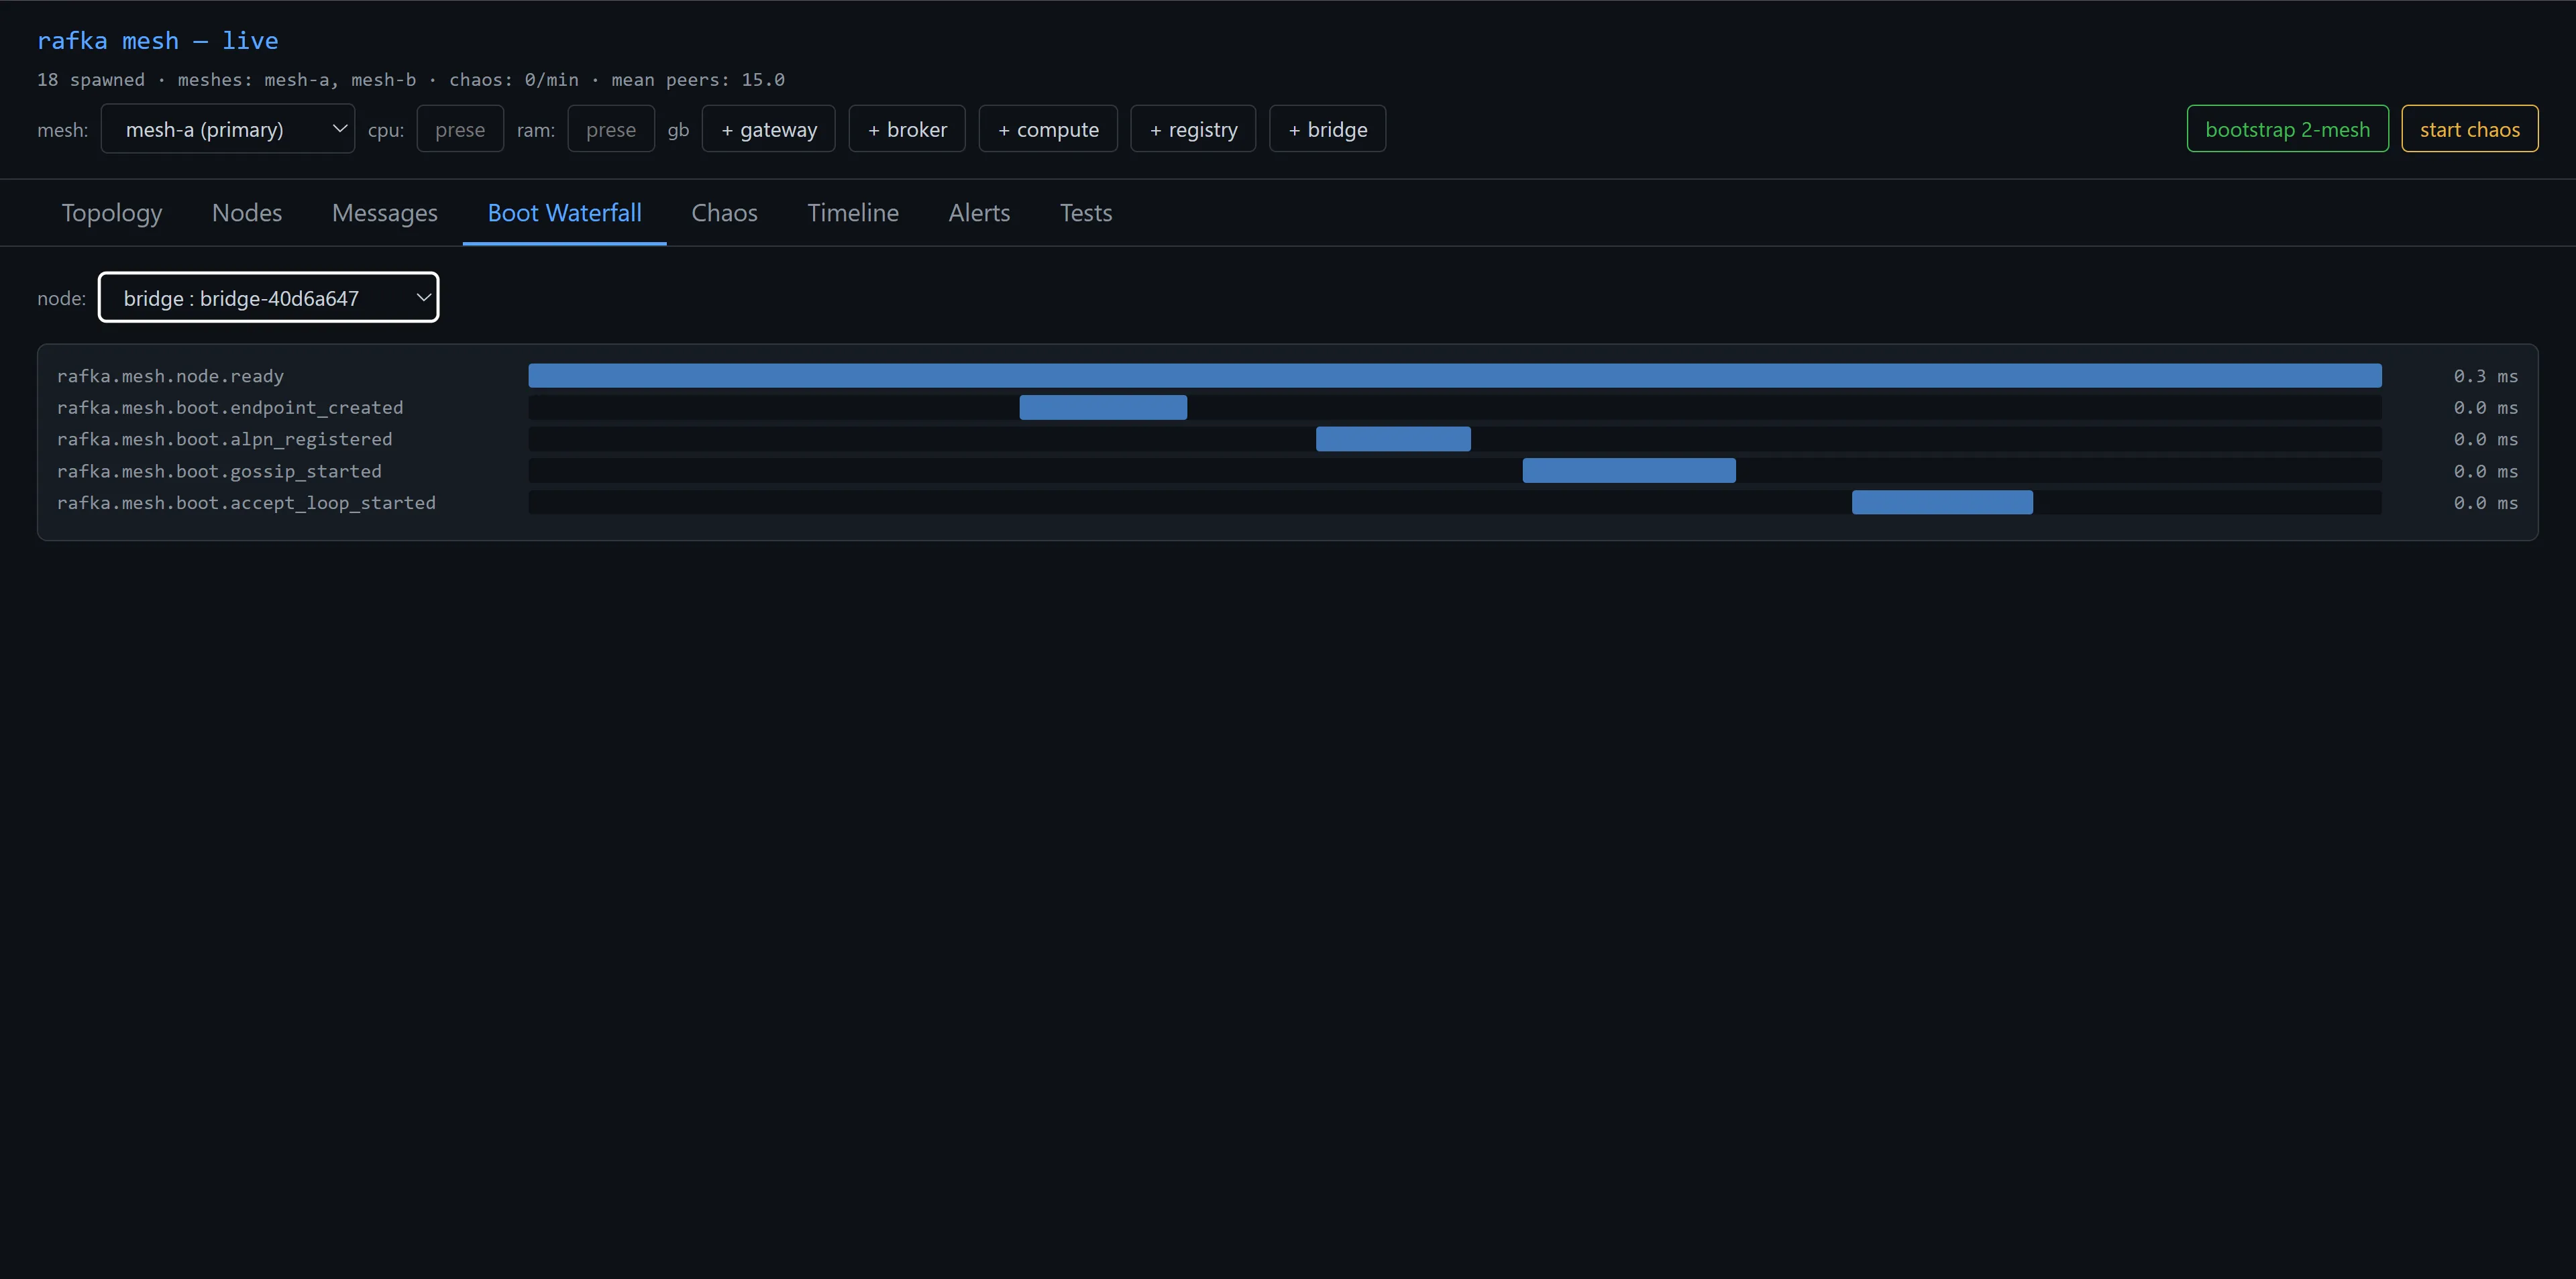
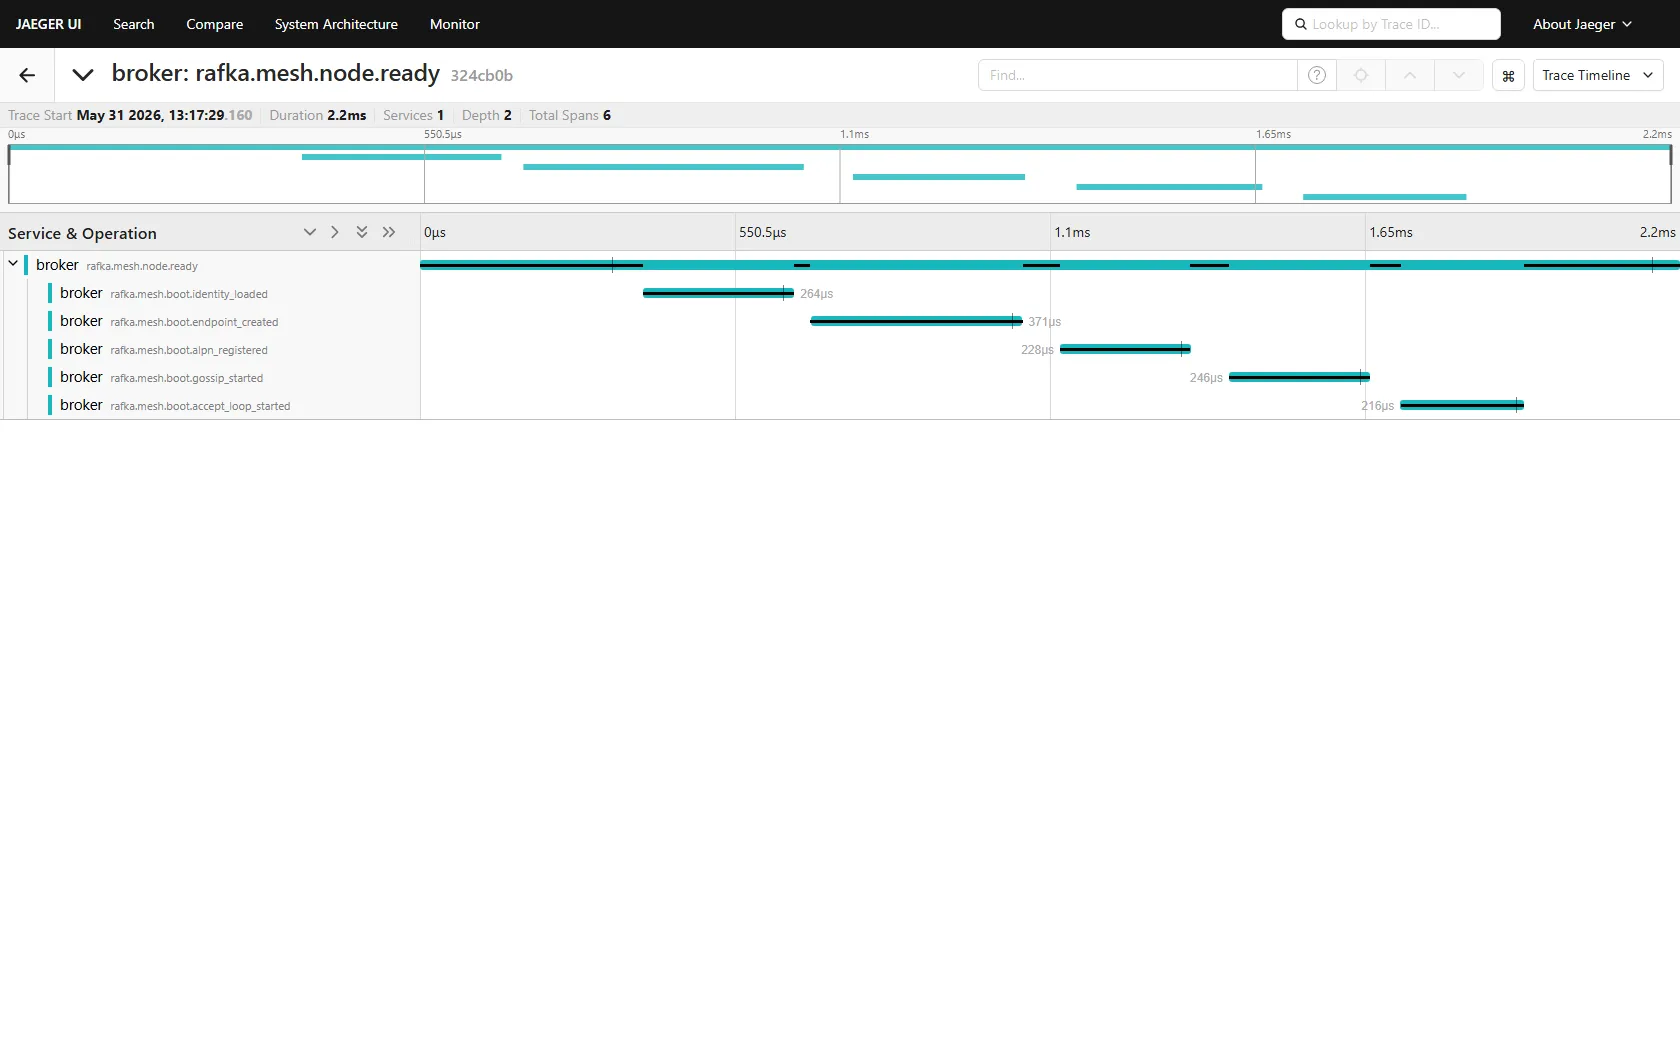
Telemetry is built in from boot. The admin-ui has a Boot Waterfall view that decomposes the spans every node fires on startup — endpoint creation, ALPN registration, gossip subscribe, accept loop. The shape of a healthy boot is five short spans nested under a mesh.node.ready root, sub-millisecond each on this machine. When something goes wrong at boot, you see which span stretched.
What I expect to break
I'm writing this down on purpose so I can be honest about the hypotheses going in:
- Gossip volume. At 18 nodes broadcasting every 500ms, that's 36 broadcasts/sec. Plumtree fans each one out across the spanning tree. I expect to find that 500ms is too aggressive for steady-state health.
- OTLP overhead. Every span we emit becomes a protobuf-encoded gRPC frame to Jaeger. If I'm not careful about what fires at what level, the telemetry will cost more than the work it's measuring.
- Connection accounting. Peers will reconnect over time. I expect there's a bookkeeping bug somewhere — registries that grow without pruning, connections that close without their tasks knowing. I haven't found it yet.
What I don't expect — and would be surprised by — is iroh itself being expensive in some fundamental way. The library is maintained by people who deal with this for a living.
What I'd tell someone starting
- Pick the substrate first. The choice of transport (raw TCP, gRPC, iroh, libp2p, …) determines everything else. Don't pick the wire format before you've picked the network.
- Don't broadcast state on a clock unless you've measured what it costs. Most "heartbeat" patterns assume small clusters, small payloads, slow cadences. Two seconds with a 200-byte digest at 18 nodes is already 36 broadcasts/sec.
- Build the dashboard first. Or at least the topology view. You're going to be looking at this thing constantly while you debug it, and a
print!doesn't compose into a mesh layout.
What's next
Tomorrow I bootstrap 18 nodes on my workstation and see what they do at idle. The plan: spawn one of each type, then 17 more, let them gossip for a minute, look at the numbers. The next post in this notebook is what those numbers were and what I did about them.
 Part 02 of 16
 When 18 nodes pegged my 80-core box at 100%
First bootstrap of 18 mesh nodes on an 80-logical-core workstation. Host CPU pegged at 100% the moment the bootstrap finished. Three obvious things to try first — mDNS off, gossip interval up, per-frame INFO spans down — got it from 100% to 35%. Still wrong. The real bug was somewhere else.
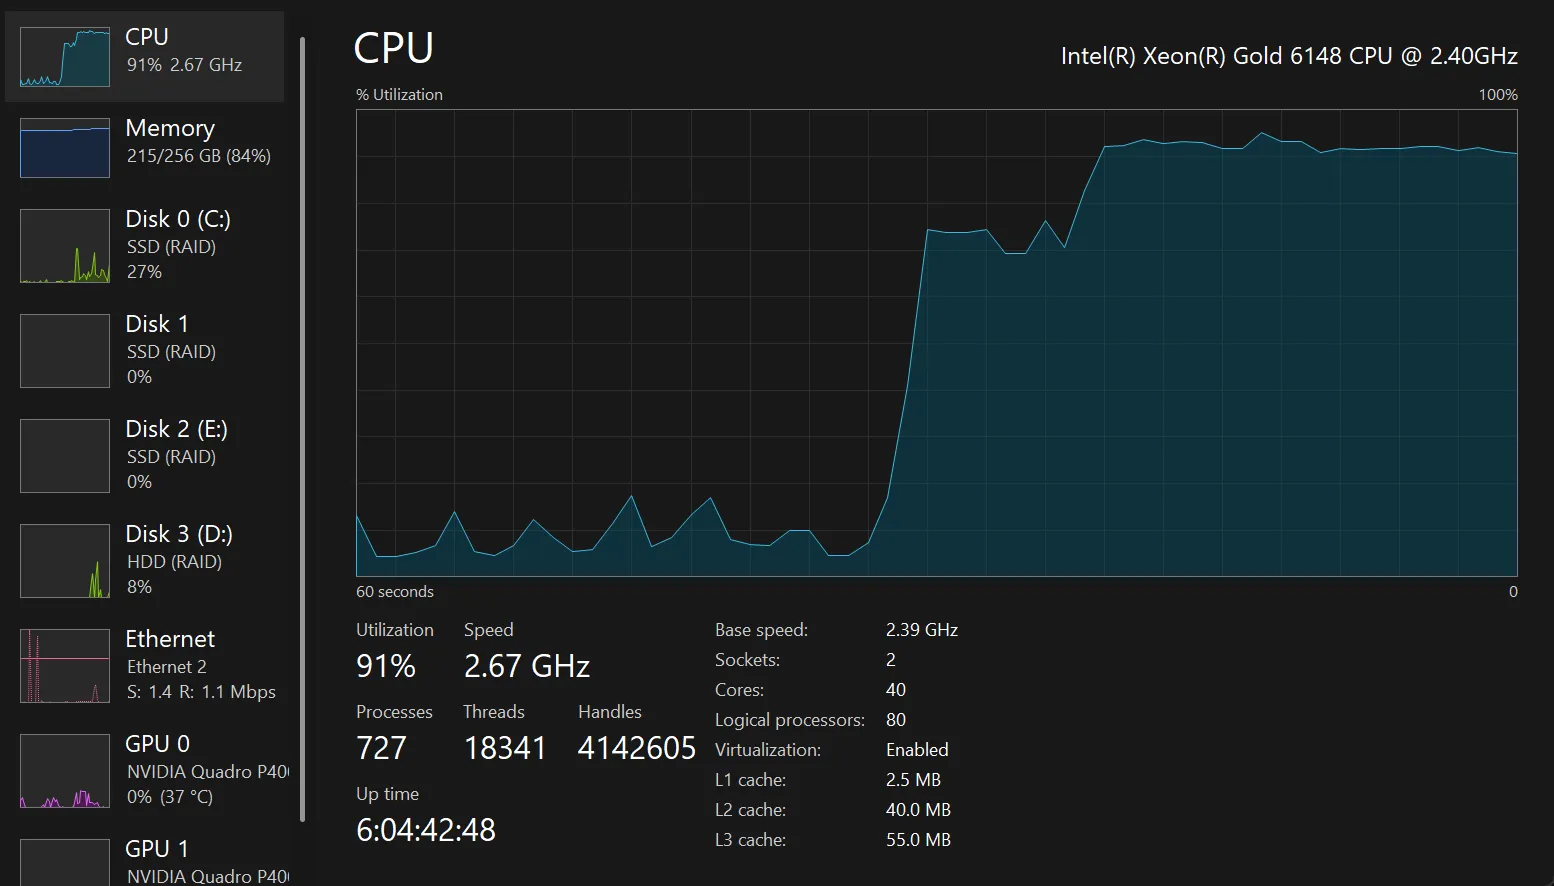
Bootstrapped the cluster. 18 nodes — two of each role per mesh, across two meshes, with two bridges. Hit Bootstrap at 14:51 local. Host CPU at 14:52 was 100% across all 80 logical cores. Five samples a second apart, all 100%.
The mesh worked. /api/topology came back with 19/19 live (the admin-ui plus 18 children). Each node's GossipDigest was arriving. The Topology view in the dashboard painted. Bytes were moving. Nothing was crashing.
It was just consuming the entire machine to do that.
What the first reading said
I'd expected ~10% host load. The two Xeon Gold 6148s in this box are not a small machine — 80 logical processors, hyperthreaded across two sockets. A handful of small Rust processes broadcasting 200-byte digests every 500ms should not be pegging the entire system. My mental model of "iroh-gossip at 18 nodes" was Bitcoin-territory: single-digit % per node.
The actual reading per-process via Task Manager:
| Node | CPU % | What I expected |
|---|---|---|
mesh-broker.exe × 4 | 0.66–1.52 each | ~0.05 |
mesh-gateway.exe × 4 | 0.72–1.32 each | ~0.05 |
mesh-compute.exe × 4 | 0.67–0.86 each | ~0.05 |
mesh-registry.exe × 4 | 0.63–1.80 each | ~0.05 |
mesh-bridge.exe × 2 | 0.82–0.83 each | ~0.05 |
mesh-admin-ui.exe × 1 | 3.44 | ~1.0 |
Add the column up: ~18% of the 80-logical box, before counting iroh-quinn's kernel-side work. Performance Monitor's \Processor(_Total)\% Processor Time showed 95–100% sustained. Something else was eating the headroom.
The shape of the cost — every process burning roughly the same amount regardless of how many peers it had — pointed at per-tick work rather than per-peer work. So I started with three suspects that fire on a clock.
Three obvious things to try
1. Turn off mDNS
iroh-mdns was discovering every node on the local network and adding it to the active peer set. On a single box, that means 17 mDNS-announced peers per node — each one getting a QUIC handshake, each one getting added to HyParView's active view (which should be ~5, not 17). I had a hunch that the cluster was forming a full mesh rather than a sparse spanning tree.
MESH_MDNS_ENABLE=false, with explicit seed nodes injected at spawn time (admin-ui as the universal seed, plus 1–2 already-spawned same-mesh peers). Each child boots, dials its seeds, and lets HyParView shape the rest from there.
2. Slow the gossip cadence
MESH_GOSSIP_INTERVAL_MS was 500. At 18 nodes that's 36 broadcasts/sec across the cluster. For a control-plane heartbeat, that's overkill — Kafka's KRaft heartbeats every 1–3 seconds and considers a broker dead after 9 missed cycles. There's no reason substrate health needs 2 Hz granularity.
Bumped to 2000ms. 9 broadcasts/sec cluster-wide. Plumtree's IHAVE retransmits handle any actual loss.
3. Demote per-frame INFO spans to TRACE
This one I caught by reading the stdout. Every received gossip digest fired a tracing::info_span!("mesh.gossip.received", ...). With Plumtree's eager-push fanout, each digest arrives at a node ~17 times (once per peer in the active view, before lazy IHAVE deduplicates). At 36 broadcasts/sec × 17 fanout × N nodes, the cluster was producing ~2,600 INFO-level events per second.
Each event goes through tracing-subscriber's formatter (stdout write), then tracing-opentelemetry's layer (build a protobuf span, push to the OTLP batch queue, eventually send to Jaeger over gRPC). That's not free.
INFO is for state transitions — peer connected, peer disconnected, gossip topic subscribed. Per-frame events should be TRACE so they're filtered before any of that fires.
// before
tracing::info_span!("mesh.gossip.received", ...)
    .in_scope(|| info!(...));

// after
tracing::trace_span!("mesh.gossip.received", ...)
    .in_scope(|| tracing::trace!(...));
The reading after
Host CPU dropped from 100% to ~35%. Per-node CPU dropped from 0.5–1.5 cores down to roughly 0.25 cores. The log volume cratered — admin-ui's stdout went from 261,000 lines in 50 seconds to about 41,000.
That's a real improvement. It's also still wrong. A self-organizing P2P mesh of 18 idle nodes should not be using a quarter of a logical core per node. Bitcoin nodes idle at single-digit percent of one core, not 25% of one.
The hypothesis I started forming: "iroh-gossip itself is just expensive at this scale, the architecture is wrong, we should pivot to a centralized Controller." I spent two days seriously sketching the Controller architecture — a single coordinator, every node holds one connection to it, hub-and-spoke at the protocol layer. It would have worked. It would have been a much bigger change.
Before I committed to it, I decided to flamegraph the running cluster first.
That's the next post.
What I'd tell a team
- Symptoms that look like "X is fundamentally too expensive" usually aren't. They're usually "you're doing X on a faster clock than you measured." Slow the clock before you blame the protocol.
- Comment the cadence on every periodic loop. The 500ms gossip interval was a placeholder I never revisited. A code comment claiming "// every 500ms is fine, gossip is cheap" would have been a lie regardless of intent. Better: don't claim it's fine, claim what you measured.
- INFO is for state transitions. TRACE is for per-frame events. DEBUG is for the boundary between those two — "useful when investigating, noisy in steady state." If you can't draw the line cleanly, your spans are doing too much.
What's next
The 35% reading was the trap. It looked like I was making progress, and it was real progress — but it convinced me the remaining cost was structural rather than a bug. The next post is the flamegraph that showed me how wrong I was, and the one-line fix that took the cluster from 35% to 5%.
 Part 03 of 16
 Flamegraphing your way out of "this can't possibly be right"
Two days into sketching a centralized-controller rewrite, I took a flamegraph instead. The hottest function in the mesh wasn't anything in the gossip protocol. It was an idempotent peer-join call I was making 10 times a second per peer — generating 3,240 QUIC handshakes per second across the cluster, doing exactly nothing useful.
I was two days into sketching a Controller architecture for the mesh. The reasoning went: 18 nodes at 35% host CPU after the obvious wins meant iroh-gossip itself was just expensive, the architecture was wrong, and the right move was a hub-and-spoke pattern with a coordinator that every node holds one connection to. A central sequencer instead of a peer-to-peer swarm. The model that's supposed to be the safe choice.
Halfway through the spike I noticed I hadn't actually profiled anything. The case for the Controller rewrite was built on a measurement gap, not a measurement. I closed the editor, added tracing-flame = "0.2.0" to the workspace, captured 15 seconds of flame data, and rendered it.
The graph was lopsided in a way that didn't fit my model.
What the flamegraph said
The dominant function in every node's CPU profile was iroh::endpoint::connect. Not Plumtree dissemination. Not packet decode. Not OTLP export. The thing every node was spending most of its time on was opening QUIC connections — at thousands of calls per second, on an 18-node cluster where nothing was disconnecting.
That should not be happening at all.
I went looking for who was calling endpoint.connect() in the hot path. The chain led to a sender.join_peers(peer_ids) call inside run_gossip's 100ms tick loop. There was a comment right next to it claiming:
// Feed mdns-discovered peers to gossip so the swarm forms.
// join_peers is idempotent — calling every tick with the current peer
// registry is cheap.
The comment had two correct words and one fatal one. "Idempotent" was true — calling join_peers with the same set of peers leaves the gossip state unchanged. "Cheap" was a lie. Idempotent in outcome says nothing about cost: under the hood, iroh interprets each call as "establish a transport connection to each of these peers," which kicks off a fresh TLS 1.3 handshake on top of QUIC's 1-RTT setup. Every time. For every peer. On a 100ms timer.
At 18 nodes with ~5 peers each in the active view: 18 × 5 × 10/sec = 900 handshake attempts per second per node, 3,240 cluster-wide. All landing on already-established connections that didn't need re-establishing. All doing exactly nothing useful for the gossip protocol.
The fix
A HashSet<String> of peers I've already told gossip about. Only call join_peers for entries that aren't in the set.
let mut joined_peers = HashSet::new();
loop {
    tokio::select! {
        _ = tick.tick() => {
            let mut new_peers = Vec::new();
            for peer in registry.iter() {
                if !joined_peers.contains(peer.key()) {
                    if let Ok(id) = iroh::EndpointId::from_str(peer.key()) {
                        new_peers.push(id);
                        joined_peers.insert(peer.key().clone());
                    }
                }
            }
            if !new_peers.is_empty() {
                let _ = sender.join_peers(new_peers).await;
            }
            // …rest of gossip emit loop
        }
    }
}
One commit. Rebuild. Re-canary.
Host CPU dropped from 35% to 6%. Per-node steady-state dropped to 0.05–0.10 cores. The mesh kept gossiping, the topology view kept painting, 19/19 stayed live. The Controller rewrite I'd been sketching became unnecessary in the time it took the canary to settle.
Four more bugs in the same pass
While I was in there, the flamegraph and the diff surfaced four more:
Ghost tasks under #[instrument] on infinite loops. Two background loops (run_ping_sender, watch_mdns) were decorated with #[instrument(skip_all)]. On a normal short-lived async function, that creates a span that closes when the function returns. On an infinite loop, the root span never closes, and every event inside it gets appended to the span's child-event queue forever. OpenTelemetry's batch processor walks that queue on every export tick — over time, the walk is the cost. Removed the #[instrument] macros from the loop functions. Their inner spans still exist.
A busy-wait on a closed channel. Inside another tokio::select!, when the gossip event channel closed, the arm did continue — which made the task immediately re-poll, which immediately yielded None again, on a tight loop with no yield point. Changed to break. The task exits cleanly on channel close instead of spinning at 100% of one core.
Ghost QUIC connections on peer reconnect. When a peer disconnects and reconnects with the same identity, reg.insert(peer_id, new_conn) overwrites the registry entry without closing the previous Connection. iroh-quinn allows multiple parallel connections from the same identity, so the old one just sits there alive. The run_frame_reader and run_bi_echo_reader tasks holding the old Connection keep parking on accept_uni() / accept_bi() forever. Over hours of churn, dozens of dead connections accumulate per node. Fix: close the old connection before overwriting.
if let Some((_, old_conn)) = reg.remove(&peer_id) {
    old_conn.close(0u32.into(), b"superseded by new connection");
}
reg.insert(peer_id.clone(), conn.clone());
Stop-removing-from-sets. joined_peers never shrank. mesh_id_registry only inserted, never removed on disconnect. Both were minor compared to the join_peers storm, but both are real leaks over a long-running cluster. Added joined_peers.retain(|p| registry.contains_key(p)) on each tick, and mesh_id_registry.remove(&peer_id_str) next to the existing registry.remove in the disconnect handler.
What I'd tell a team
- Comments lie. Flamegraphs don't. Every CPU bug I found had a comment next to it claiming the code was cheap. The comment described intent, not cost. If you're inheriting a codebase, treat every "this is cheap" comment as a hypothesis to verify.
- Don't blame the protocol before you've measured. I came within a day of forking the architecture to a Controller pattern. The reasoning was internally consistent: gossip-fanout costs grow with peer count, we have a peer-count problem, therefore replace gossip. The flamegraph showed it had nothing to do with peer count — it was a 100ms tick doing the same expensive thing repeatedly. The architecture wasn't the bug.
#[instrument]on an infinite loop is almost always wrong. Spans are scoped to function lifetime. An infinite loop's span lives forever. Use#[instrument]on the work inside the loop, not on the loop itself.- Idempotent ≠ cheap. "Calling this multiple times has the same effect" says nothing about the cost of the calls. Especially in network code —
endpoint.connect()is idempotent from the application's perspective but does a full TLS handshake every time.
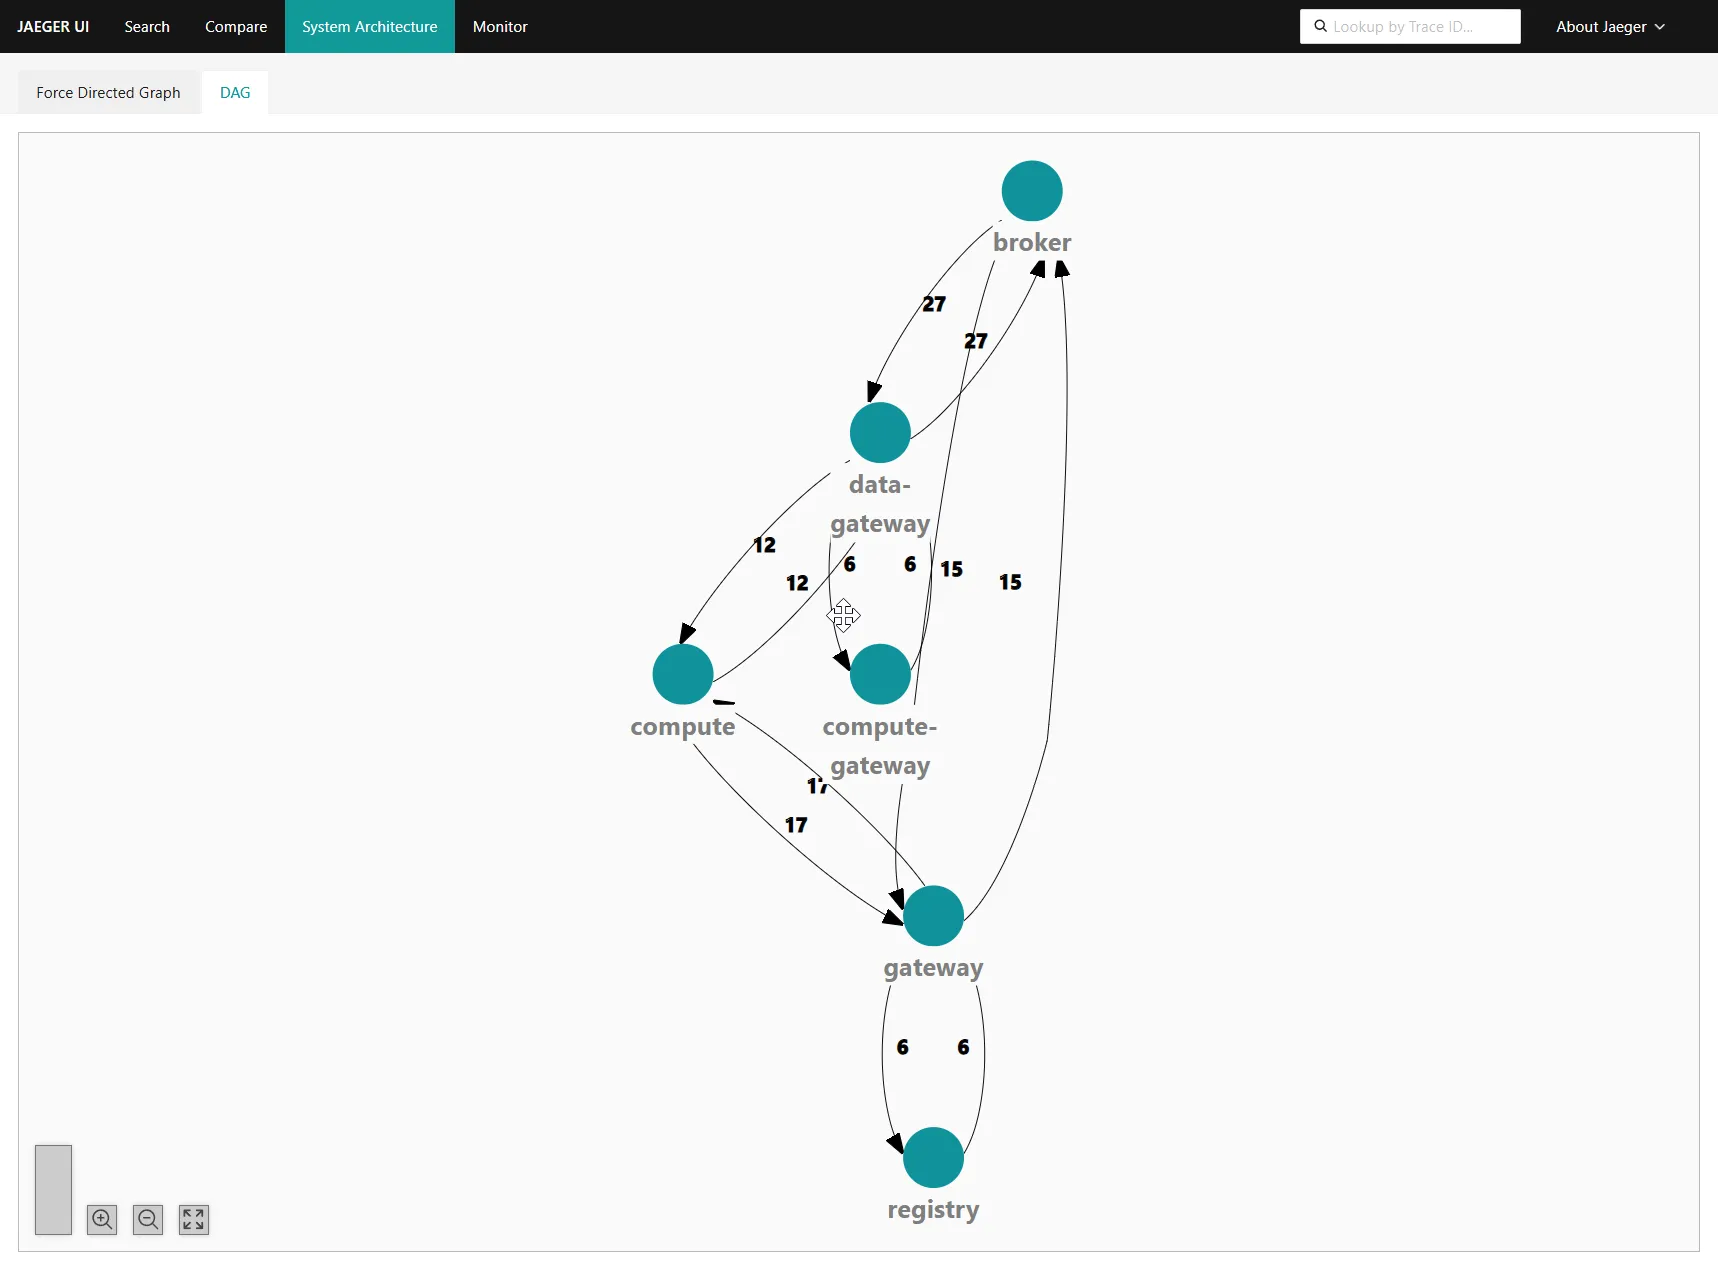
For a second-channel sanity check, the Jaeger service-architecture DAG agreed with the dashboard. Service-level call counts looked reasonable for the workload, not the four-figures-per-second I'd been seeing pre-fix:
What's next
The 6% reading held for an hour. I left it running overnight to soak. The next morning it was at 100% again.
Different bug. Slower. Worse, because it took an overnight run to surface. Next post.
 Part 04 of 16
 Four days into the soak, the RAM was still climbing
Left the cluster running. Per-node CPU at 5% was real. The leak was somewhere else. Over 4 days of soak, 18 nodes climbed from 1 GB total RAM to 12 GB — and the worst offenders were nodes with zero active peers, holding the most state. Five accumulating data structures, no pruner, the time-tested pattern of "we'll clean it up later" never quite getting cleaned up.
After the join_peers storm fix the canary settled. Host CPU 6%, per-node CPU 0.05–0.10 cores, mesh stable, 19/19 live. I left it running overnight, expecting to come back to roughly the same numbers in the morning.
It came back to 100%.
Five days later, with the soak still going on the same processes, the numbers looked like this:
| Metric | t=0 fresh | t+32min | t+105h (now) |
|---|---|---|---|
| Total CPU (sysinfo sum) | 1.38 cores | 2.59 cores | 14.90 cores |
| Total RAM | 1.04 gb | 1.32 gb | 11.87 gb |
| Per-node avg CPU | 0.077 | 0.144 | 0.83 |
The previous post celebrated 0.05–0.10 cores per node. Four days later the average was 0.83. Eleven times worse. The cluster wasn't crashing; it was eroding.
The fingerprint that didn't fit
The shape of the cost was the giveaway. Looking at top consumers after four days:
| Node | Peers | CPU | RAM |
|---|---|---|---|
compute-8ac4eca1 | 1 | 2.57 cores | 2.35 gb |
gateway-16bfa75a | 0 | 1.88 cores | 1.64 gb |
compute-fbedd6ed | 0 | 1.39 cores | 1.11 gb |
broker-d8329b3a | 0 | 0.94 cores | 0.64 gb |
The nodes burning the most CPU had zero peers. That's a contradiction in a healthy mesh — a node with no peer connections should be idle. Either the work isn't happening on connections at all, or the connections aren't being counted right.
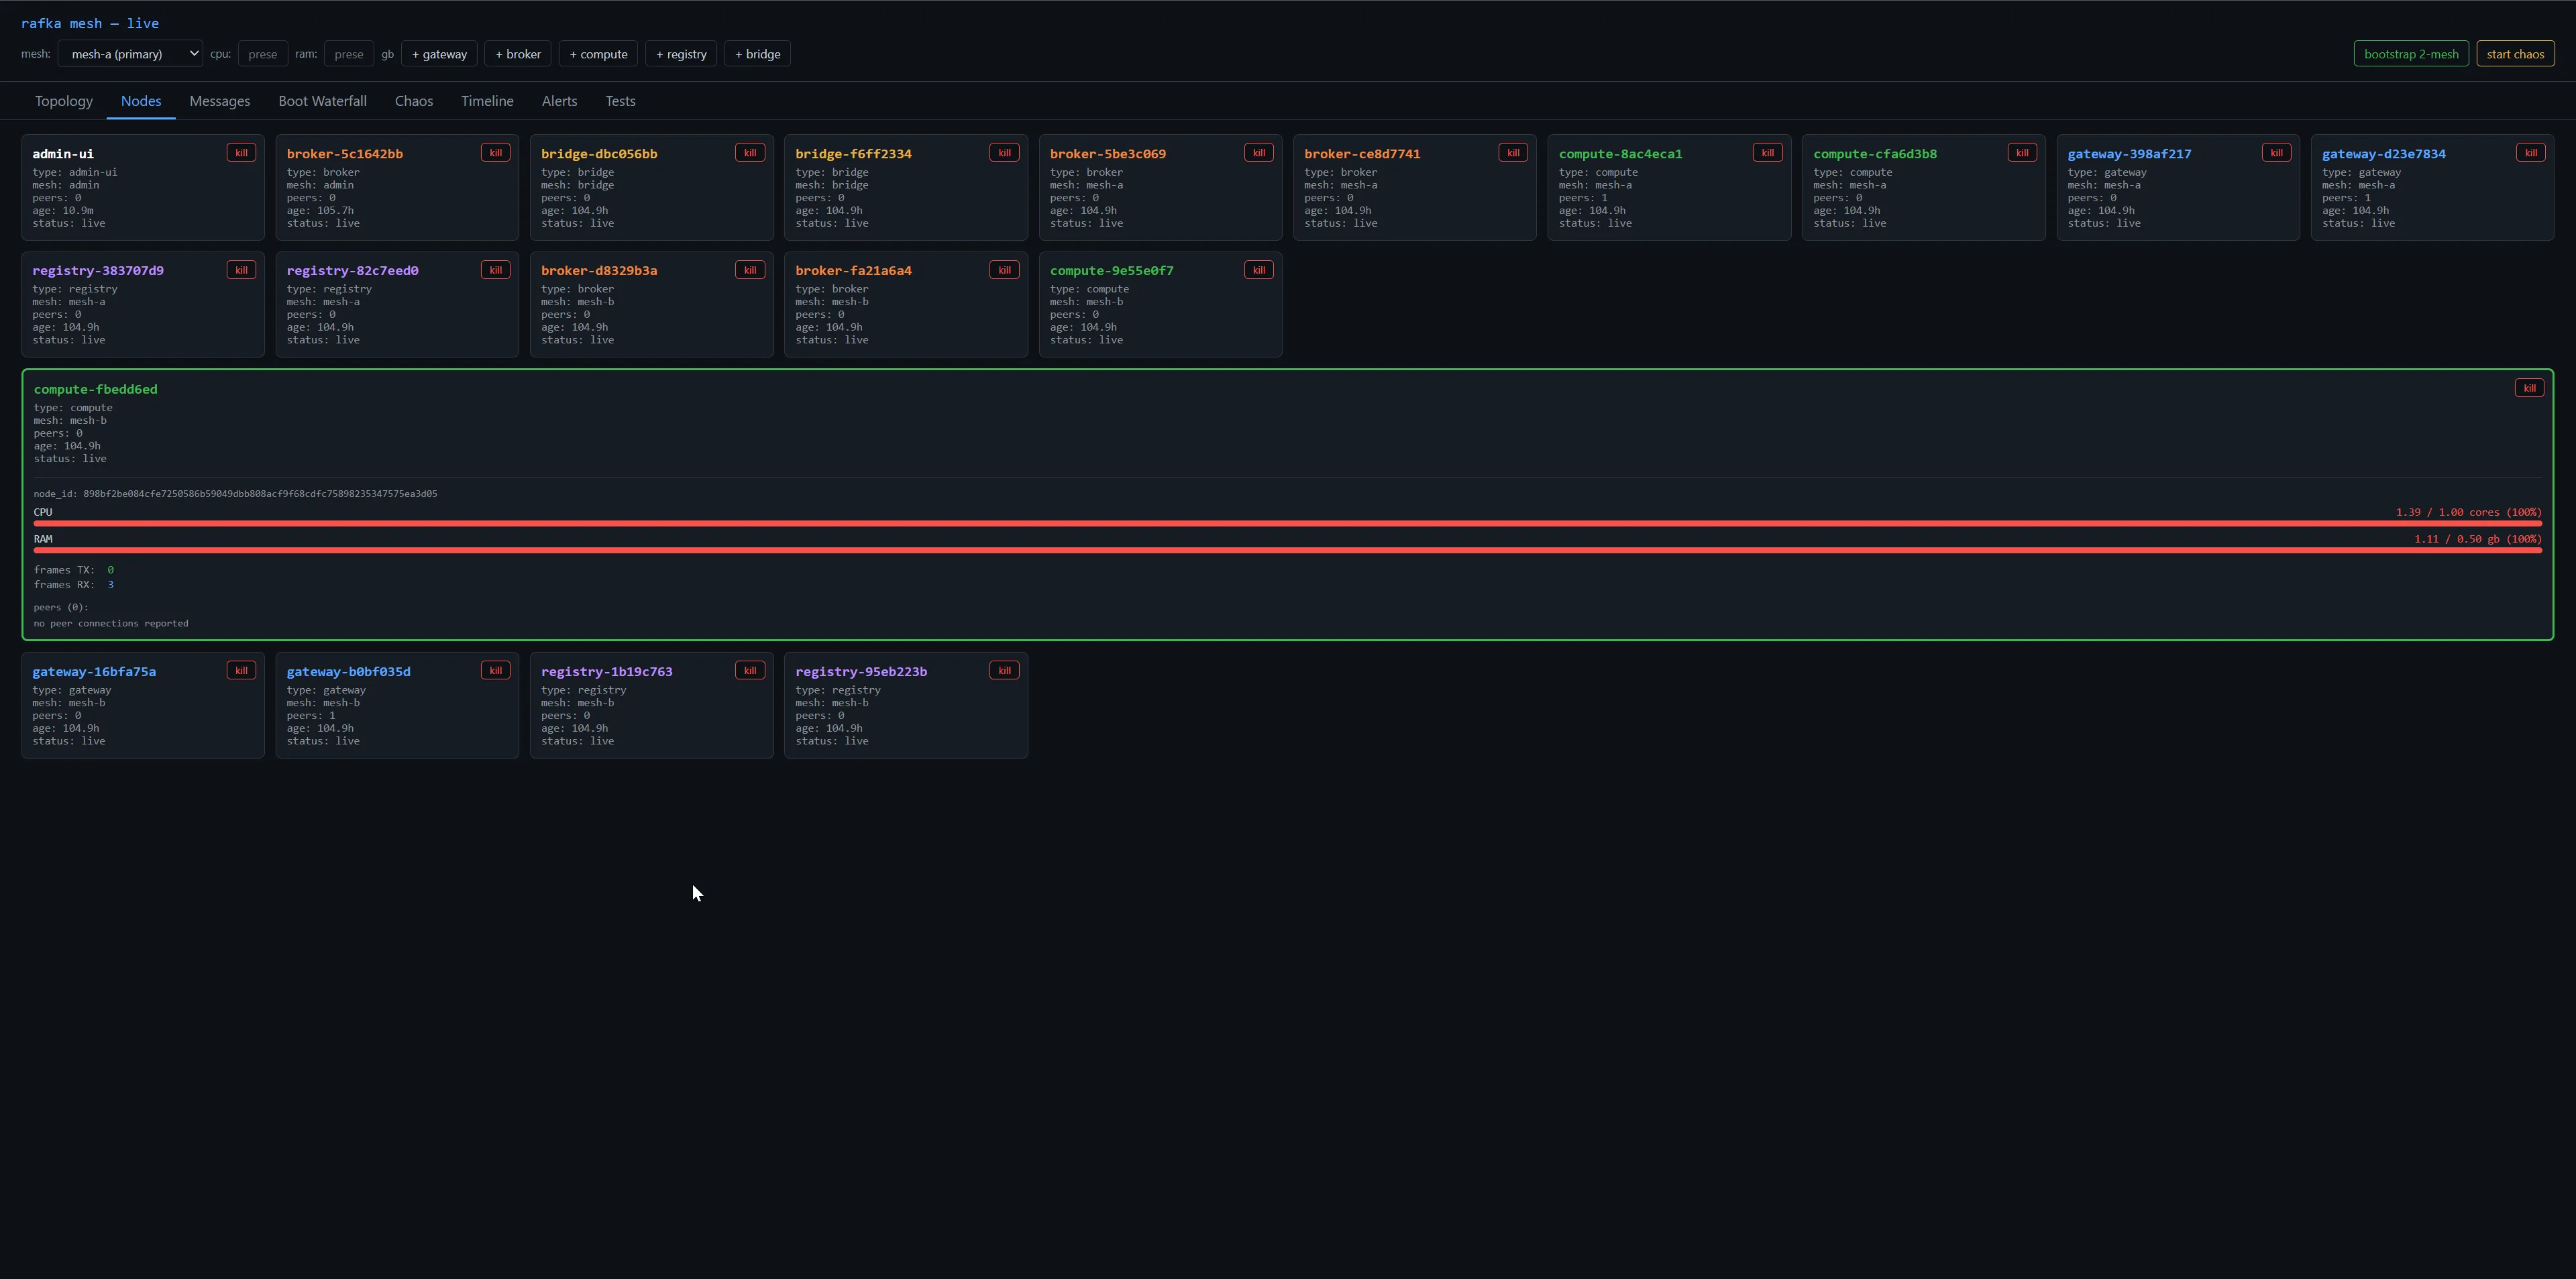
Both turned out to be true. The work was happening on connections the peer count didn't know about — closed-but-not-cleaned Connection handles still pinned by background tasks — and on global maps that had been growing for 105 hours without anyone telling them to shrink.
Five leaks, in order of impact
1. Ghost QUIC connections on peer reconnect
iroh-quinn allows multiple parallel connections from the same identity. When the same peer reconnects after a network blip, the application sees a new Connection; the old one just sits there alive until something explicitly closes it. The accept loop was doing this:
reg.insert(peer_id.clone(), conn.clone());      // overwrites registry
tokio::spawn(run_bi_echo_reader(conn_bi));      // holds clone of new conn
run_frame_reader(/* ... */, conn /* moved */);  // holds new conn
What it never did was close the previous Connection before overwriting the entry. The old run_frame_reader task was still parked on accept_uni() of the old conn, which would never error because the old conn was never closed. Same with run_bi_echo_reader and accept_bi(). They sat there forever, holding Connection clones and keeping iroh-quinn's per-connection state (congestion controller, TLS session, packet pacer) live.
Fix:
if let Some((_, old_conn)) = reg.remove(&peer_id) {
    old_conn.close(0u32.into(), b"superseded by new connection");
}
reg.insert(peer_id.clone(), conn.clone());
Connection::close causes both accept_uni and accept_bi on the old conn to return Err, the old tasks break out cleanly, the iroh-quinn state drops.
2. live_digests and topic_membership grow forever
Two process-global DashMaps. live_digests is keyed by node_id with the latest GossipDigest received from that node. topic_membership is keyed by topic-label with a set of node_ids ever seen on that topic. Both are populated on every received digest. Neither had a pruning mechanism.
Every cluster respawn (and there had been many over the week of debugging) added entries with new node_ids — admin-ui pre-mints a fresh keypair per spawn, so every restart creates a new identity. Old identities never broadcast again. Their entries stay forever.
Fix: a single background task on a 5-second timer that scans live_digests, drops entries whose wall_time_ms is older than MESH_STALENESS_MS (default 30 seconds), then removes those node_ids from every topic's membership set.
async fn run_staleness_pruner() {
    let staleness_ms: u64 = std::env::var("MESH_STALENESS_MS")
        .ok().and_then(|s| s.parse().ok()).unwrap_or(30_000);
    let mut tick = tokio::time::interval(Duration::from_millis(5_000));
    loop {
        tick.tick().await;
        let now_ms = SystemTime::now()
            .duration_since(UNIX_EPOCH).map(|d| d.as_millis() as u64).unwrap_or(0);
        let stale: Vec<String> = live_digests().iter()
            .filter(|e| now_ms.saturating_sub(e.value().wall_time_ms) > staleness_ms)
            .map(|e| e.key().clone()).collect();
        for node_id in &stale {
            live_digests().remove(node_id);
        }
        for mut topic_entry in topic_membership().iter_mut() {
            for node_id in &stale {
                topic_entry.value_mut().remove(node_id);
            }
        }
    }
}
The self-injection on each node's gossip emit refreshes its own wall_time_ms, so a live node's entry never goes stale.
3. mesh_id_registry never pruned
Parallel to the peer PeerRegistry, there's a mesh_id_registry: DashMap<String, String> that maps peer_id → peer_mesh_id, populated from Hello frames so bridges can know which mesh a peer belongs to. The disconnect handler removed the peer from PeerRegistry but left the entry in mesh_id_registry. Over the soak, that map grew with every peer ever seen.
One-line fix in the existing disconnect handler:
Err(_) => {
    registry.remove(&peer_id_str);
    mesh_id_registry.remove(&peer_id_str);  // added this
    // ...
}
4. joined_peers HashSet only ever inserted
The fix from the previous post — joined_peers to dedupe join_peers calls — was correct, but I never made it shrink. If a peer disconnects, its entry in PeerRegistry is gone, but its entry in joined_peers lingers. On reconnect, the new connection wouldn't get join_peers called for it, because the old entry was still there.
joined_peers.retain(|p| registry.contains_key(p)) on every tick. Self-trimming.
5. dial_seeds one-shot, no retry
Not a leak per se but discovered during the same audit. dial_seeds did a single endpoint.connect() per seed at boot. If the seed wasn't up yet (race during cluster bootstrap), the child was permanently isolated — no retry, no fallback. Replaced with per-seed tokio tasks doing exponential-backoff retry: 1s, 2s, 4s, 8s, 16s, capped at 30s, max 10 attempts. Spans mesh.seed.retry and mesh.seed.giveup are emitted at INFO so seed-side issues are visible in Jaeger.
What I'd tell a team
- Soak the substrate before you trust it. A 30-second canary won't catch slow leaks. Five minutes won't either. The bugs in this post took 4 days to surface in a meaningful way. If your substrate matters, leave it running overnight before you ship anything on top of it.
- Process-global state needs an owner. Every
DashMapthat lives for the process lifetime needs a clear answer to "what removes entries from this?" If the answer is "nothing, the process restarts and it's fine" — that's a hidden cluster-restart dependency. Add a pruner. - Closed channels and overwritten registry entries are not free. The
tokio::select!continueon a closed channel that spins a core, theDashMap::insertover an existing key whose value held resources — both compile, both look fine in review, both cost you real CPU and memory. When you find yourself overwriting a key whose previous value held something withDropsemantics (aConnection, aJoinHandle, aFile), explicitly handle the old value. - The fingerprint matters. Top CPU consumers having zero peers was the clue. It told me the problem couldn't be peer-count-dependent — it had to be time-dependent and stateful. That narrowed the search from "anywhere in the gossip protocol" to "what state grows when we lose connections."
After the five fixes landed I started another soak, this time with the new pruner emitting mesh.staleness.pruned spans every 5 seconds and a 30s MESH_STALENESS_MS window. The topology view stayed populated with real values rather than ghost entries:
What's next
Steady-state works. The next question is what happens under load that isn't steady — when nodes die, when links flap, when clocks drift. The chaos battery I built for Sprint 02 has been sitting unused while the CPU work happened. Next week I unleash it on the substrate I just got working.
 Part 05 of 16
 Chaos-pass replaces tests-pass
Steady-state passing isn't good enough for a substrate. I built a chaos harness with 13 primitives — kill, restart, partition, wedge, flap, clock-skew, slow-link, lossy-link, the works — and ran it against the just-stabilized mesh. Twelve tests, eight chaos-class, all green. Here's what each primitive surfaces and why "tests pass" by itself doesn't mean the substrate is sound.
After the soak fixes settled, the cluster ran flat for a week. CPU bounded, RAM bounded, peer counts stable, no nodes silently eroding. That's a green light for "the substrate works at idle," not for "the substrate is shippable." A control-plane substrate that only behaves under steady-state is the kind of thing you discover is broken six hours into an incident, when a single broker has been flapping and the rest of the cluster can't decide if it's dead.
So this week I pointed the chaos battery at it.
The principle
Sprint 02 of this project locked Golden Principle #5: chaos-pass replaces tests-pass. The idea isn't novel — Netflix put Chaos Monkey in production a decade ago, Jepsen has been making distributed systems vendors look bad since 2013. The novel part for this substrate is that the chaos battery is the same harness regardless of which feature sprint is running. Every sprint's exit criterion has to be "the existing tests pass under chaos," not "the existing tests pass."
That gives you a forcing function. A test that's green at idle but flaky under PartitionPair is broken, not flaky — the substrate has a real failure mode you're now choosing to ignore. The chaos battery is what stops you from ignoring it.
The primitives
The chaos crate (crates/mesh-chaos) ships thirteen primitives. Each one is a Rust struct implementing ChaosPrimitive with three things: an apply() that does the damage, a revert() that puts things back, and a detect() that tells the test framework what evidence to look for in the OTLP spans to confirm the substrate noticed.
| Primitive | What it does | What it surfaces |
|---|---|---|
KillNode | SIGKILL one node | Connection-drop detection; staleness pruner |
RestartNode | Kill + respawn same identity | Reconnect path; ghost-connection cleanup |
BurstKill | Kill multiple nodes at once | Quorum/membership behavior under sudden loss |
WedgeNode | Pause node's tokio runtime | Slow-vs-dead distinction; backpressure |
DiskFull | Fill data dir | Identity file fsync failures; graceful degradation |
PartitionPair | Break connectivity between two nodes | Spanning-tree heal; alt-path routing |
PartitionSubset | Isolate a subset from the rest | Split-brain detection; bridge survival |
FlapLink | Repeatedly up/down a peer link | Reconnect storms; idle-timeout interaction |
FirewallInbound | Drop inbound traffic to a node | Asymmetric failure; outbound-still-works case |
ClockSkew | Skew a node's wall clock | Staleness comparison robustness |
NatShift | Simulate NAT remapping | iroh's hole-punch re-establishment |
SlowLink | Add latency to a link | Backpressure; head-of-line blocking |
LossyLink | Drop a % of packets on a link | Plumtree's IHAVE retransmit path |
Eight of those have corresponding test files (tests/chaos/*.rs). The other five are in the harness but not yet wired into named tests — they're available for ad-hoc cluster torture.
The run
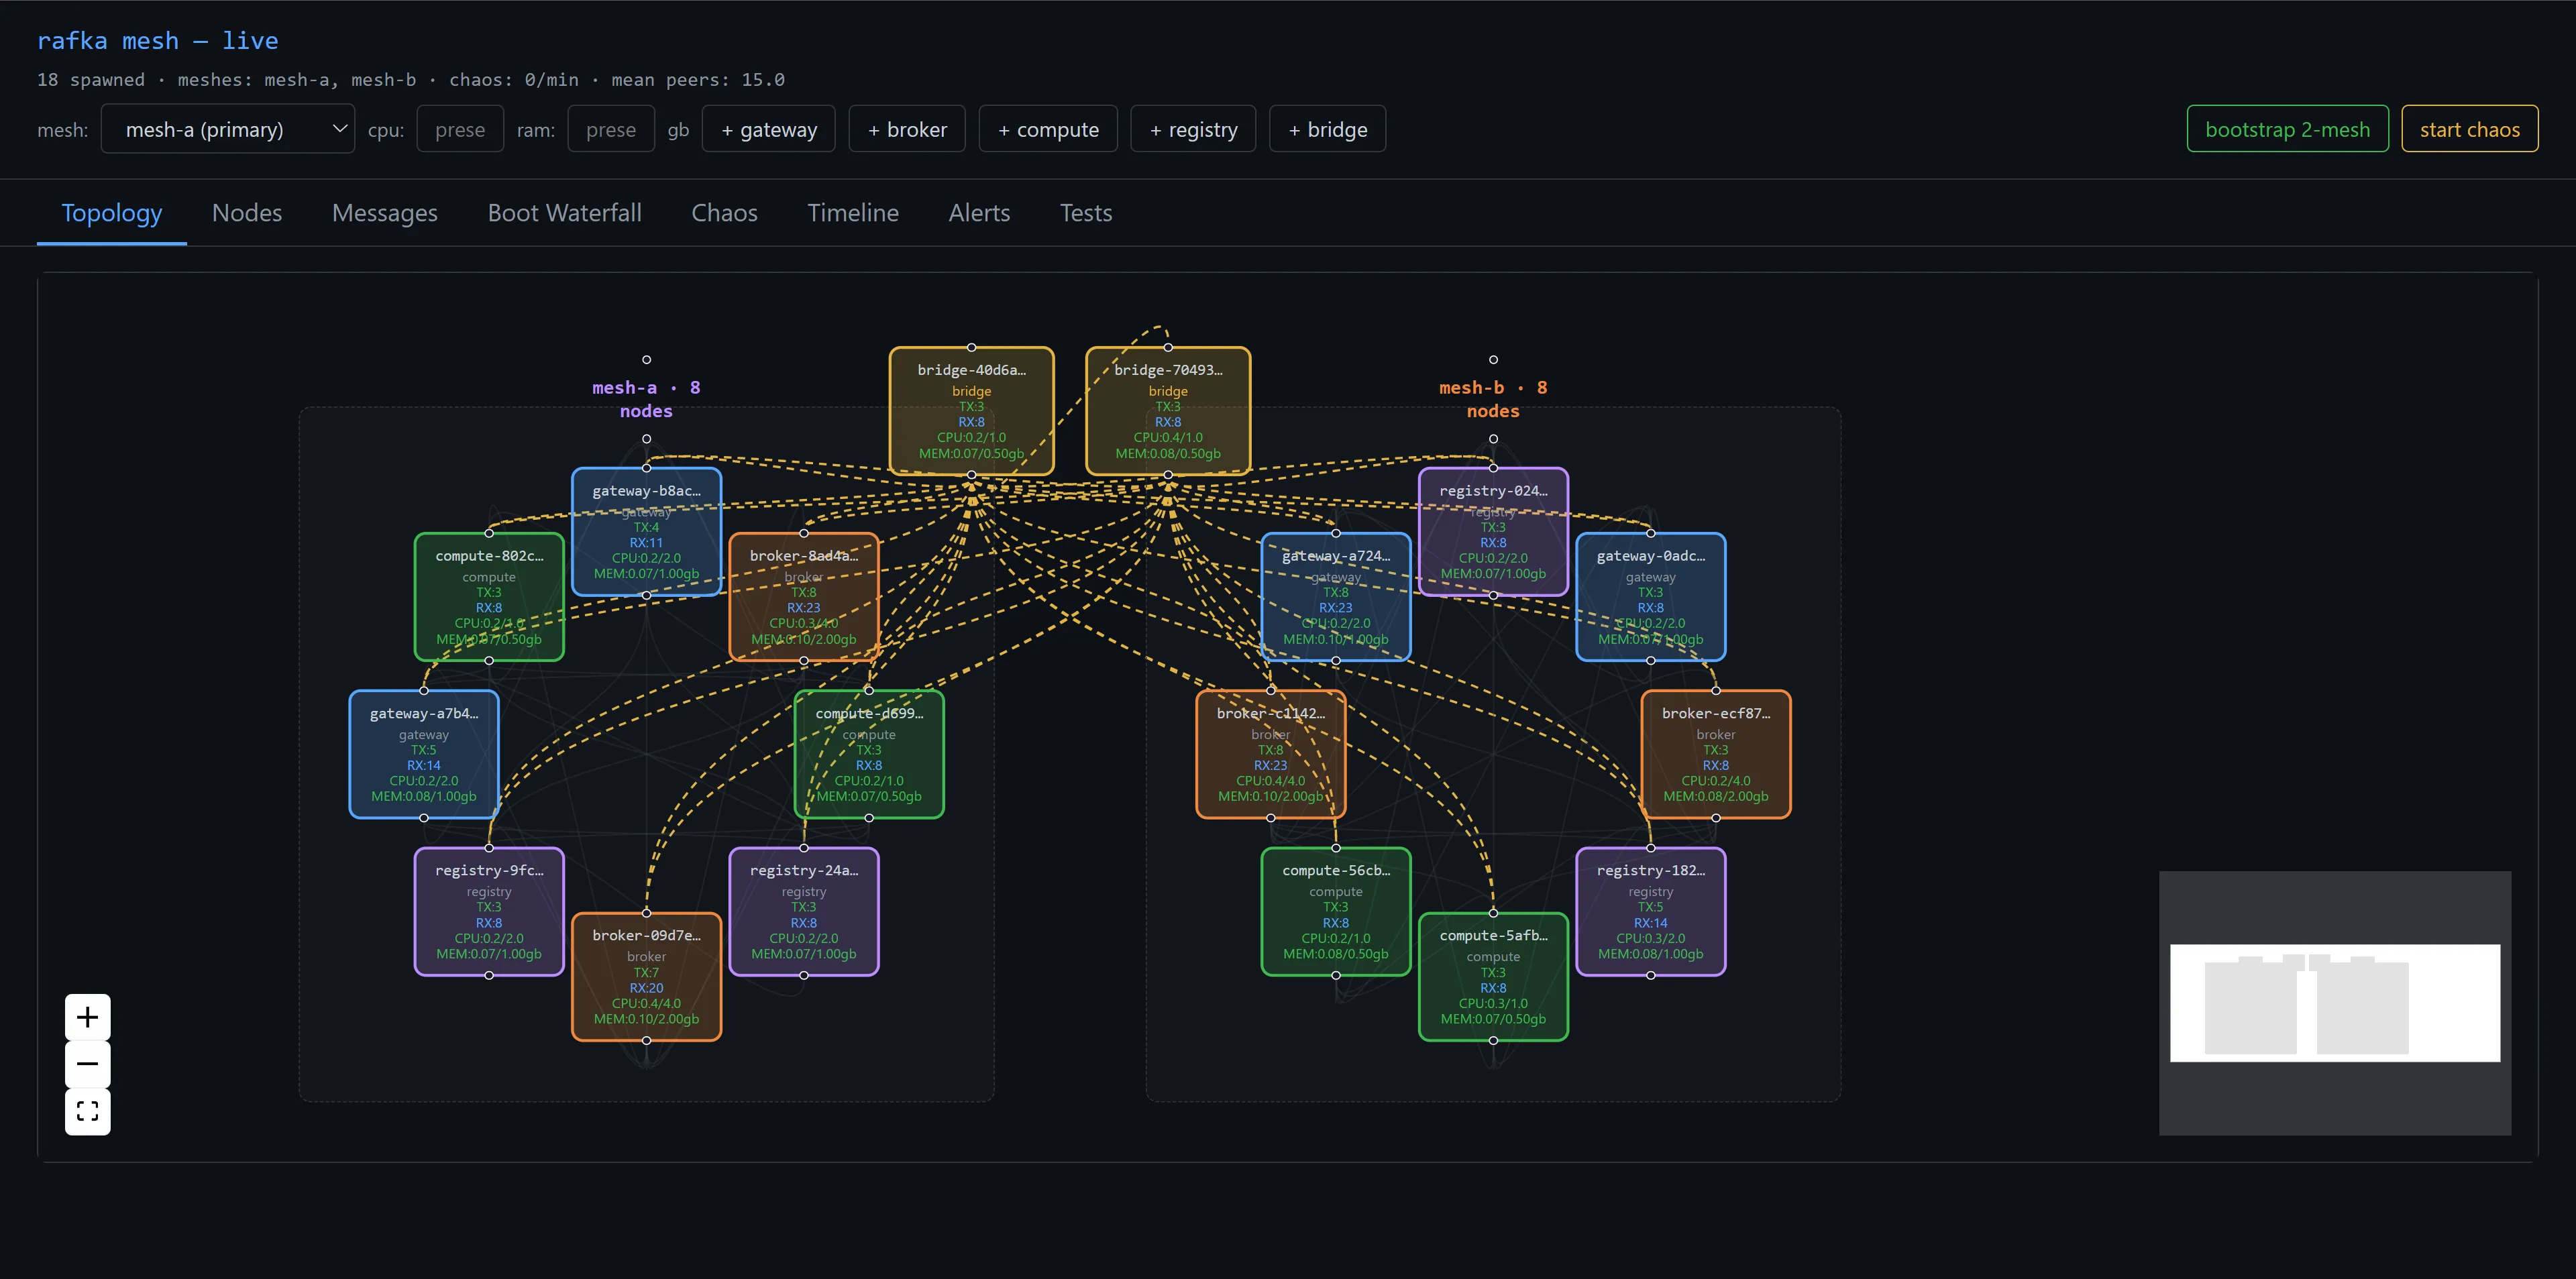
I bootstrapped 18 nodes — the standard 2-mesh layout, with bridges — and pointed the test runner at the chaos battery. The admin-ui Tests tab is where I watched the results land.
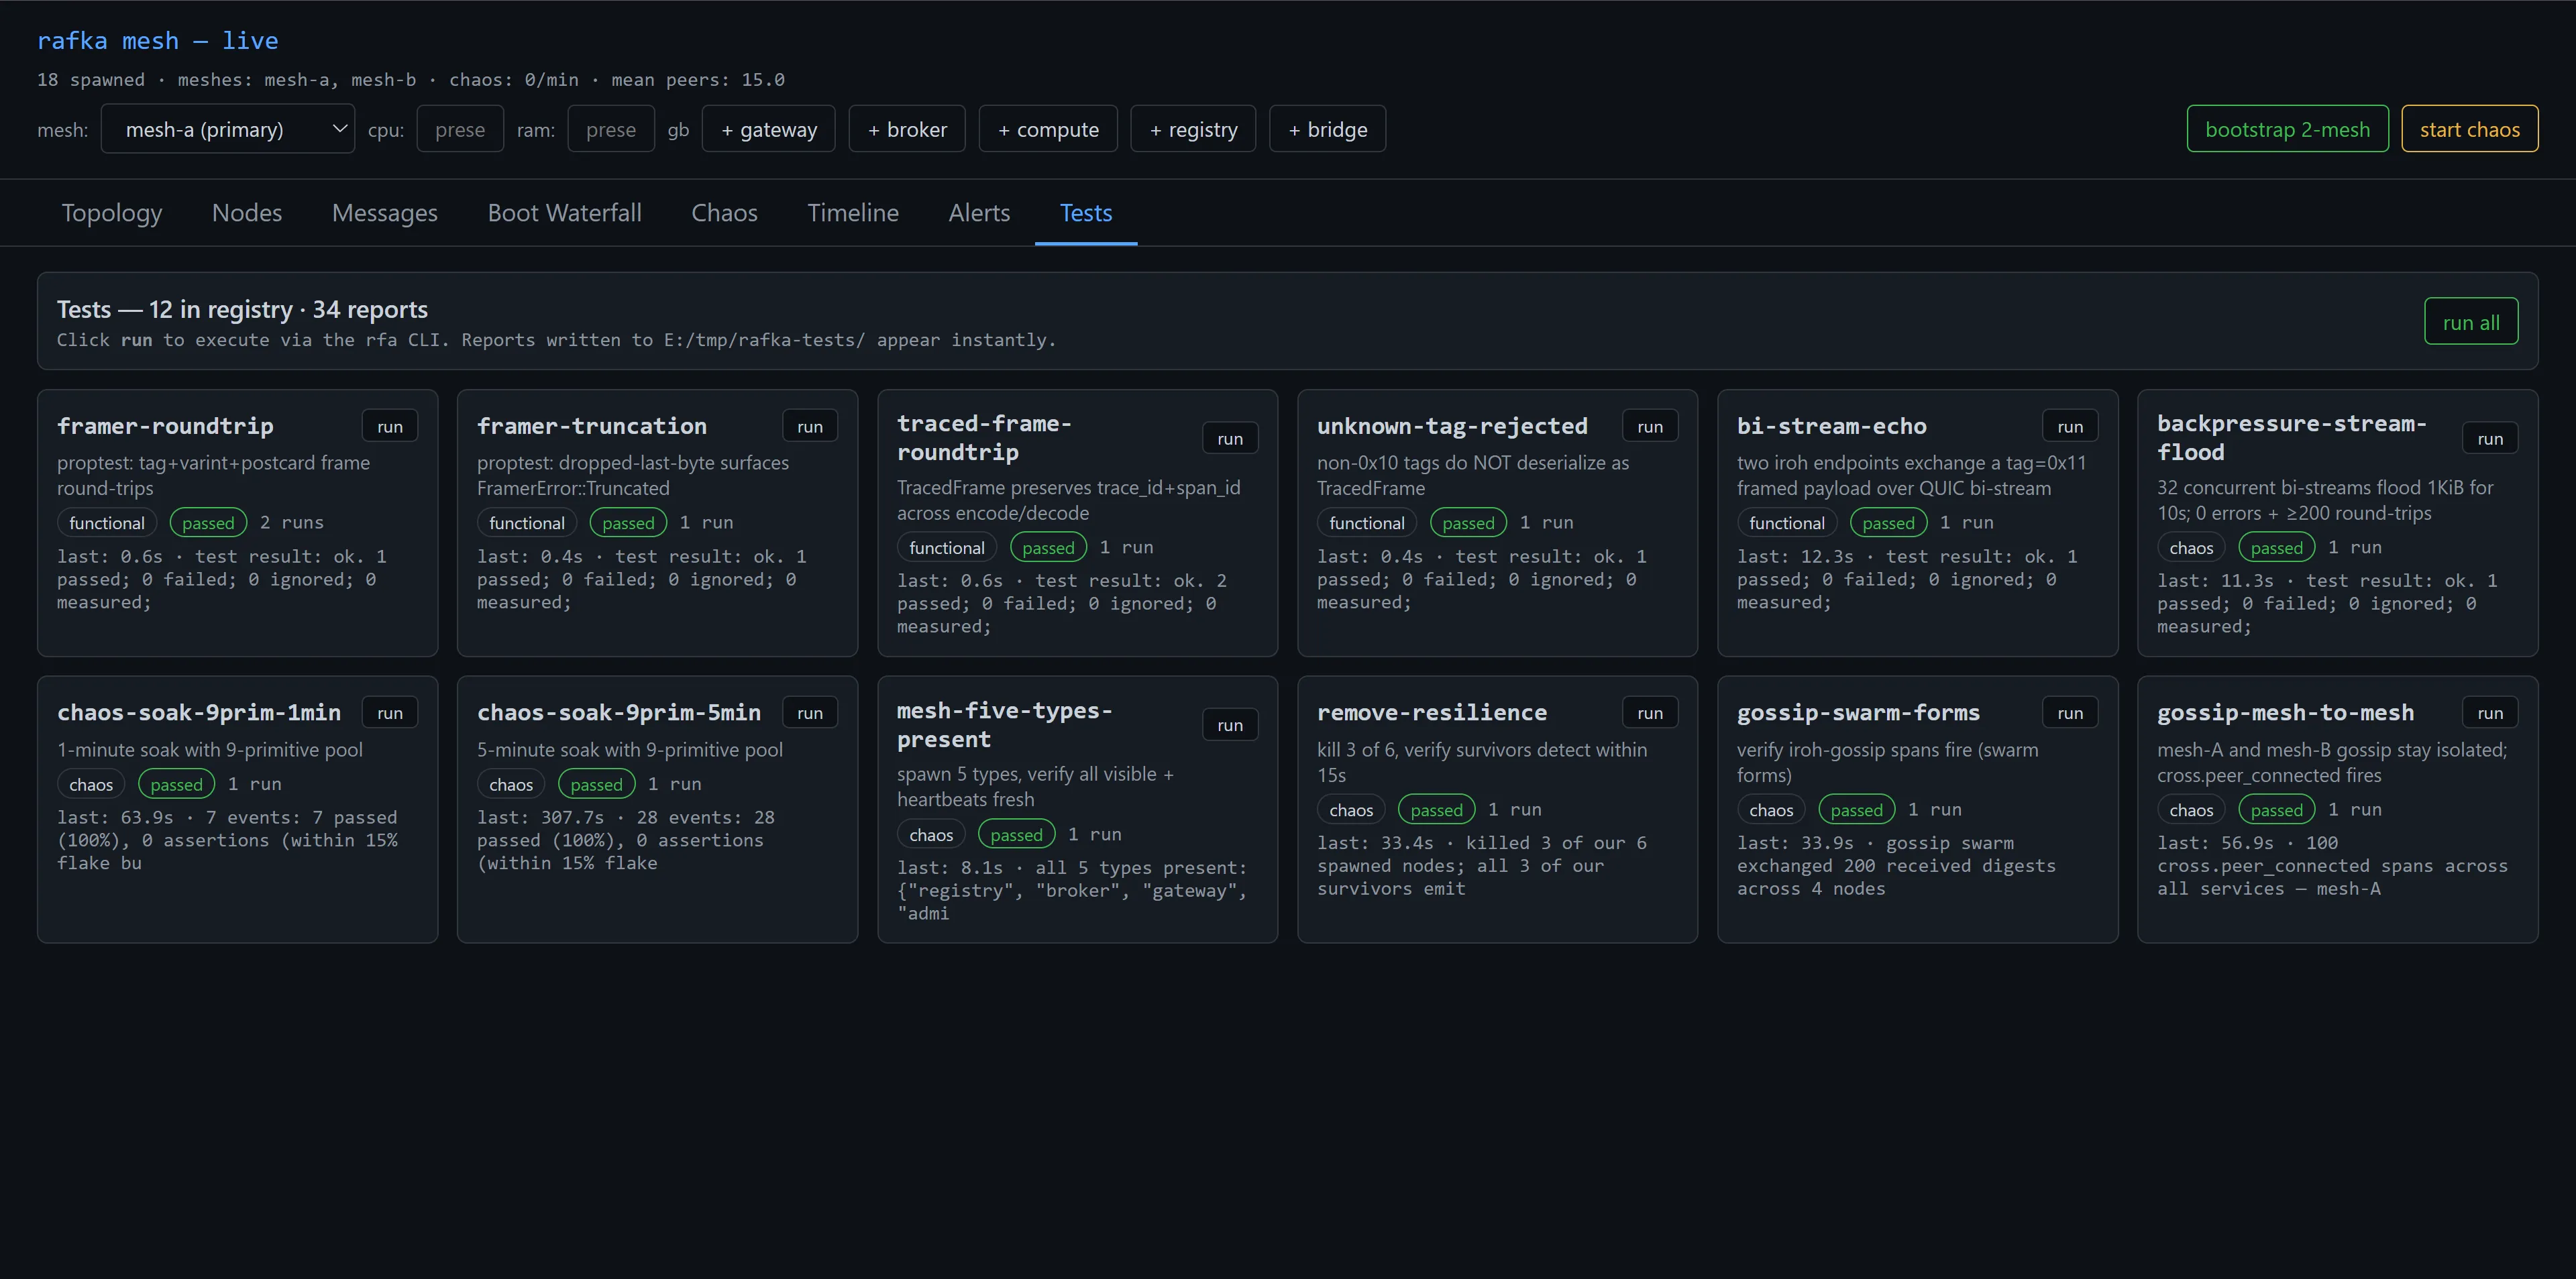
The numbers worth pulling out of that grid:
chaos-soak-9prim-5minran 307.7 seconds, fired 28 chaos events, all 28 passed within the 15% flake budget. That's the headline test — 5 minutes of continuous random chaos, the substrate doesn't fall over.remove-resiliencekilled 3 of 6 spawned nodes and verified all 3 survivors continued emitting heartbeats. The substrate notices, prunes the dead entries, keeps going.gossip-swarm-formsasserts that after a clean boot 4 nodes exchange ≥200 gossip digests within 34 seconds. That's the basic "Plumtree is actually doing its job" test.gossip-mesh-to-meshverifies that 100mesh.cross.peer_connectedspans fire across all services within 57 seconds — proving the bridge architecture actually bridges.backpressure-stream-floodfires 32 concurrent bi-streams of 1 KiB payloads for 10 seconds. 200+ round-trips, 0 errors. The data plane survives concurrent load.
What chaos catches that integration tests don't
The interesting one to me is the gap between the functional tests on top (5 of them — framer round-trip, frame truncation, traced-frame, unknown-tag rejection, bi-stream-echo) and the chaos tests on the bottom (7 of them, all chaos-tagged).
A functional test like framer-roundtrip answers "does the framer encode and decode correctly when nothing else is going on." That's necessary. It is not enough. The framer also has to be correct when the surrounding QUIC connection is being killed by KillNode, when the receiving node is being wedged by WedgeNode, when packets are being dropped by LossyLink. The chaos tests run the same framer code against those conditions.
backpressure-stream-flood is the cleanest example. The flood test by itself would catch "can the substrate do 200 round-trips in 10 seconds." It can. The chaos-tagged version of the same test catches "can it do 200 round-trips in 10 seconds while three random chaos primitives are firing in the background." That's a different question.
The timeline view is where chaos-period vs. steady-period events become legible. Every peer.connected event shows up with its source and target; chaos events get their own timeline rows; you can see them interleave in real time.
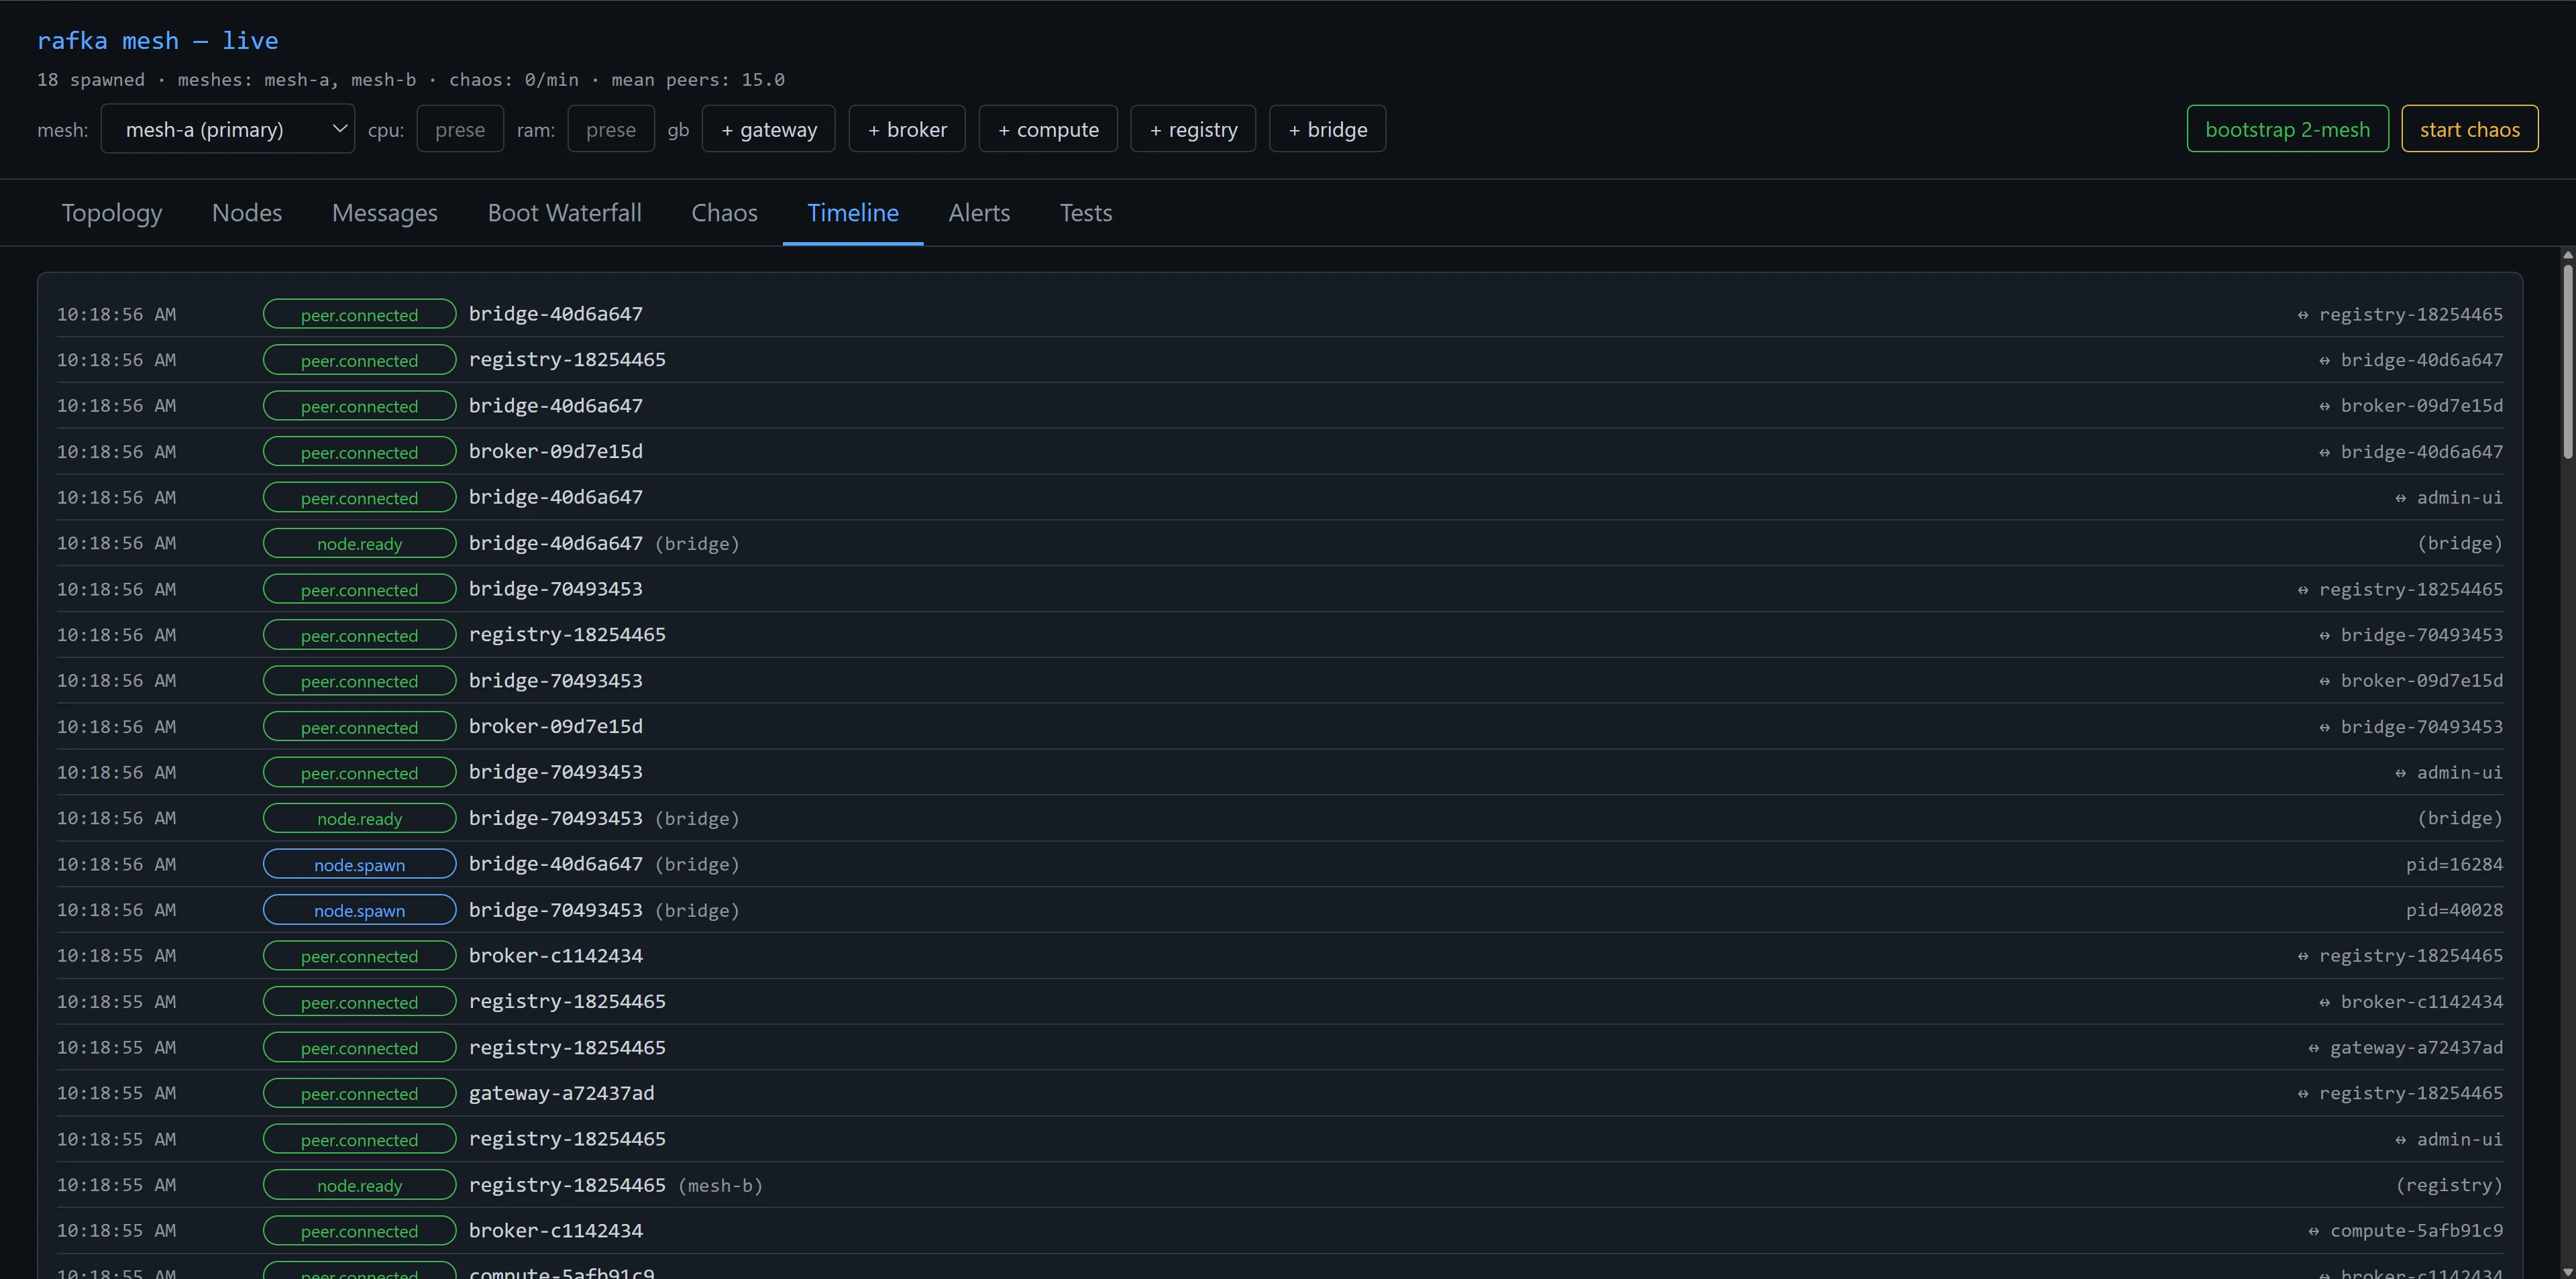
When the chaos harness fires KillNode, you see a node disappear from the timeline. Within a few seconds you see the surviving nodes re-establishing connections — peer.connected events fan out across the substrate as HyParView reshuffles the active view. The chaos worked; the substrate responded; both are visible.
What I'd tell a team
- Steady-state is the baseline, not the target. If your test suite only runs at idle, the test suite isn't done. It says nothing about how the substrate behaves under the conditions you'll actually encounter in production. Idle is the easiest case; you need the hardest cases too.
- Build chaos primitives once, reuse them everywhere. The 13 primitives in
mesh-chaosare shared between unit tests, soak runs, and ad-hoc torture sessions in the admin-ui. The cost amortizes immediately. The alternative — every test author writing their own kill-the-broker helper — gives you 5 incompatible flaky helpers and no shared vocabulary about what "broken" means. - Make chaos visible. The admin-ui's Chaos and Timeline tabs are not just dashboards — they're the operator's view of what's failing and what's recovering. Without them, "the test passed" is a green light and nothing else. With them, you can see the substrate noticing chaos, choosing to react, and re-establishing. The visibility is the test.
- Define a flake budget up front and stick to it.
chaos-soak-9prim-5minruns with a 15% flake budget — 4 out of 28 events can be allowed to miss their detection window before the test fails. That budget is what separates "we have flaky tests" from "we have a known reliability envelope." If the substrate ever runs at 50% flake, that's an architecture problem, not a test problem.
What's next
That closes the engineering arc. The next post wraps it up — the substrate is sound, the chaos battery is green, and the whole thing is going public. Open-sourcing it next week.
 Part 06 of 16
 Open-sourcing the Rust Distributed Mesh
Five weeks of building, breaking, and fixing a P2P mesh substrate in Rust. Today I'm pushing the whole thing public — the iroh-based transport, the gossip emit loop, the staleness pruner, the example node types, the React dashboard. Not a thing to take and run in production. A thing to read while you're building your own.
Five weeks ago I started building a P2P mesh substrate in Rust on iroh. The point was never the mesh — it was learning what it actually costs to run one before betting a real product on it. The first canary pegged an 80-core box at 100% CPU with 18 nodes idling. The fifth week's canary holds the same 18 nodes at 5%, steady-state, through a 4-day soak.
Today I'm pushing the whole repo public.
→ github.com/drlukeangel/rust-distributed-mesh
It is not a library you should take and run in production. It's a kit you can read while you're building your own. The bugs I paid for are now diffs you can study. The dashboard I built so I'd believe my own numbers is in there too — React, plain Vite, no framework. The flamegraph captures are in /profiles.
What's in the box
| Piece | What it does |
|---|---|
crates/mesh-node-base | The substrate. Identity, gossip emit loop, peer registry, LoadSampler (self-reported CPU/RAM), staleness pruner. Built on iroh-gossip 0.98. |
crates/mesh-transport | Thin layer over iroh's Endpoint. ALPN, mDNS toggle, bind addr, 30s idle timeout. |
crates/mesh-telemetry | OTLP/tracing init. Every node's spans land in Jaeger; receive-time staleness is local, not sender-side. |
admin-ui/ | React + Vite topology view. Live node grid, hub-and-leaf layout, CPU/RAM bars per node, kill button per card. The thing you stare at when you don't believe the numbers. |
broker / gateway / compute / registry / bridge | Example node types. Each one is a 10-line main.rs that calls NodeRuntime::new("type").run().await. From the substrate's perspective they're interchangeable. |
Stack: rust (substrate) · iroh 0.98 + iroh-gossip (QUIC + NAT traversal + Plumtree/HyParView) · tokio · opentelemetry → Jaeger · react + vite (UI).
The five engineering posts in this notebook walk through the work in order:
- Why I'm building a distributed mesh substrate in Rust — the architecture, the iroh choice, what I expected to break.
- When 18 nodes pegged my 80-core box at 100% — the first round of obvious wins (mDNS off, gossip interval up, INFO spans down). 100% → 35%.
- Flamegraphing your way out of "this can't possibly be right" — the
join_peersstorm that I almost rewrote the architecture to escape. 35% → 5%. - Four days into the soak, the RAM was still climbing — the slow leaks that only a long-running soak surfaces. Ghost connections, unbounded global maps, the staleness pruner that ties it together.
- Chaos-pass replaces tests-pass — 13 chaos primitives, 12 tests, 5-minute soak under continuous random chaos. All green.
What the kit is, and isn't
This is a learning artifact. It is not:
- A finished product. The streaming layer that sits on top of this substrate — the actual event-streaming app — isn't open yet. What you're reading is what's underneath it.
- A managed iroh integration. It's an opinionated set of patterns for using iroh-gossip in a long-running process. Different from a library — closer to a scaffold.
- Production-ready. I've run it on one box. I haven't run it across NATs, across regions, or at scale. The substrate is correct under the workload I've tested; it's not proven outside it.
It is:
- A documented diff trail. Every fix in the four engineering posts above corresponds to a commit in the repo. You can
git logyour way through the optimization arc. - A flamegraph dataset. The 2 GB
.foldedfiles that surfaced thejoin_peersstorm are in/profiles. Runinferno-flamegraphon them and you'll see the bug. - A dashboard you can read. The admin-ui code is short — maybe 800 lines of TypeScript. It joins the mesh as a passive observer and renders the topology live. Plain React, plain Vite, no state framework. Lift it if it helps.
Telemetry is the second view of the same thing. Every span lands in Jaeger; the System Architecture DAG gives you the service-to-service call pattern without leaving the browser:
Numbers, before and after
| Metric | First canary | After five weeks |
|---|---|---|
| Host CPU (80-logical box, 18 nodes idle) | 100% | 5% |
| Per-node CPU avg | 0.83 cores | 0.05–0.10 cores |
| Per-node RAM avg | growing linearly | bounded at ~60 MB |
| Stable across 4-day soak | no — climbing on every axis | yes |
| Bugs I shipped in the first version | every single one in the four posts above | most fixed; one or two known sharp edges remain |
For comparison: a Bitcoin Core full node idles at 5–10% of one core. A Tor relay idles under 1%. The mesh substrate as it stands is competitive with both at this scale.
What I'd tell someone building one
I've said most of this in the four posts. Concentrated:
- The protocol probably isn't the bug. Measure first. I almost rewrote to a centralized-Controller architecture before checking. The flamegraph took 15 seconds to capture and made the question moot.
- Comments lie. Flamegraphs don't. Every CPU bug I found had a comment claiming the code was cheap. Trust the profile.
- Soak the substrate. A 30-second canary will not catch the bugs that take 4 days to surface. If the substrate is load-bearing, leave it running overnight before you build anything on it.
- Process-global state needs an owner. Every
DashMapthat lives for the process lifetime needs a clear answer to "what removes entries from this?" If the answer is "nothing, we just restart" — add a pruner before you ship. #[instrument]on an infinite loop is almost always wrong. The span never closes. The event queue grows forever. Decorate the work inside the loop, not the loop itself.
What's next
The streaming layer is what comes next, built on the substrate I just spent five weeks debugging — event streaming, multi-tenant by topic, nodes across networks — riding on a foundation that now actually idles when it has nothing to do. But there turned out to be one more leak hiding in the substrate first, which is where this notebook goes from here.
If you're building on iroh, fork freely. If you find a bug I missed, open an issue. The repo will keep moving.
 Part 07 of 16
 Hunting a connection leak the soak test wouldn't explain
I'd already open-sourced this thing. Then a longer, meaner soak — kill and respawn for hours, not minutes — showed RSS climbing and never coming back down, on Windows and Linux both. The bug wasn't where I'd looked before. It was a select! arm that quietly switched itself off, and two more leaks hiding behind it.
I'd already pushed this whole thing public. The mesh worked: nodes discovered each other, gossiped, survived the chaos battery. The four-day soak had already cost me five leaks and taught me to never trust a thirty-second canary. I thought I was done with this class of bug.
Then I ran a meaner soak — kill and respawn on a tight loop, the kind you leave going for hours — and watched RSS climb and never come back down. Same shape on Windows, same shape on Linux. Classic leak, and not the one I'd already fixed.
This is the story of finding it, and the three things that turned out to be wrong at once.
The trap: theorizing about the reap path
The mesh runs an iroh QUIC transport under a HyParView/Plumtree gossip layer. Under churn, peers join and leave the active view constantly, so connections are born and reaped all day long. Every reap path I traced should have worked. The connection loop returned. close() got called. The maps got pruned. I spent hours reading code that, on paper, released everything it touched.
This is the same hole I fell into before the flamegraph post — sitting there reasoning about what the code should do instead of measuring what it did. The lesson refuses to stick the first time, or the second: when a leak resists reasoning, stop reasoning and instrument it.
The breakthrough: count, don't infer
So I stopped reading and added two counters to the gossip actor — connection-loop tasks spawned versus tasks finished — and ran a short soak. The numbers ended the debate:
spawned = 174, finished = 52 → 122 connection-loop tasks stuck alive
Meanwhile the membership map sat bounded at ~15 peers, exactly as it should. So roughly 107 connection-loop tasks had no peer state behind them and yet had never exited. That contradiction — live tasks with nothing to serve — pinned the bug to one place instead of the whole gossip layer.

Root cause #1: a select! arm that switched itself off
Here's the send loop, simplified to the part that mattered:
tokio::select! {
    _ = &mut closed => break,
    Some(msg) = self.send_rx.recv() => self.write_message(&msg).await?,
    // ...
}
When a peer leaves the active view, its send_tx is dropped and recv() starts returning None. The trap is that the Some(msg) = … pattern doesn't deliver that None to me — when the pattern fails to match, select! disables that branch for the rest of the loop. The branch goes dark.
The only other long-lived arm, _ = &mut closed, stays pending forever, because nothing has actually closed the connection — that was supposed to happen because the send loop noticed the peer was gone. So the loop parks on a future that can never resolve. The send task hangs, the connection loop that owns it never completes, and the QUIC Connection and its driver task are stranded. One leaked connection for every peer that leaves — and the nodes that rotate peers the most leak the fastest.
The fix is to stop pattern-matching the channel closed away and handle the None myself:
msg = self.send_rx.recv() => match msg {
    Some(msg) => self.write_message(&msg).await?,
    None => break, // all senders dropped -> peer gone -> tear down
},
Stuck tasks went from 122 and climbing to a bounded ~15. This is a cousin of the reconnect leak from the soak post — both are a task outliving the thing it was serving — but the mechanism is different and nastier, because the code looks like it handles shutdown. The closed arm is right there. It just never gets a chance to fire.

Root causes #2 and #3, because leaks travel in packs
With connections bounded, a heap profile still grew — slower, but up and to the right. Two more, both smaller, both mine:
- Telemetry retention. The OpenTelemetry tracing layer was floored at
DEBUG. Under churn the network stack emits a debug firehose, andtracing-opentelemetryappends every captured event to the currently-active span's buffer — which is only freed when that span closes. My long-lived actor spans never close. So their event buffers grew without bound. One single 2 MB allocation in the profile turned out to be one span's event vector. The fix was a one-liner: floor the export layer atINFO. - Process-table enumeration. The per-node load sampler built its system handle by enumerating every process on the box, every tick — tens of thousands of transient name strings on Windows, every couple of seconds. It only ever needed our own process. The fix: don't enumerate the world; sample only our own pid.
Neither of those is exotic. Both are the kind of thing that compiles, reads fine in review, and costs you megabytes an hour in production.
The payoff
Measured with dhat, before and after, under the same kill-and-respawn soak:
| bucket | before | after |
|---|---|---|
| total retained heap | 42.9 MB | 8.1 MB (↓81%) |
| tracing / otel | 29.2 MB | 2.0 MB |
| sysinfo | 9.1 MB | 1.6 MB |
| quic connections | growing | bounded |

And the thing that actually matters — RSS troughs under sustained chaos went from a monotonic climb to a flat plateau, on Windows and Linux both. Over a 35-minute soak, an observer node's RSS at 140 chaos events dropped from 0.228 GB to 0.115 GB — about 66% lower — and dhat put the QUIC connection bucket at 18.7 MB → 3.85 MB.
Where the bugs actually lived
Here's the part I had wrong going in. I assumed — the way you always do — that the bug was in my code, not the library. The two small ones were: the telemetry floor and the process-table sampler were my config, one-line fixes. But the connection leak itself, the dominant one, was in the stack, and tracing it produced a cluster of fixes I submitted upstream to three crates:
- The gossip layer got the most. The
select!SendLoop footgun above; makingconnection_loopexit (it ran send and receive underjoin!, which waits for both — but the receive half blocks forever onaccept_uni()when a peer leaves locally, so I moved it toselect!); and pruning the per-peer state that outlived removed peers —peer_topics,peer_data, thelazy_push_queueonNeighborDown. Plus regression tests so the leak can't creep back. - iroh itself had a per-remote address cache (
AddrMapbehindmapped_addrs) with no eviction path — it grew once per remote ever seen under churn. The clean-shutdown path now evicts the departing remote's cached addresses. - The QUIC layer underneath leaked a whole connection task, packet spaces, and channels whenever a
Connectingwas dropped before its handshake finished — and before the handshake there's no idle timeout to eventually reap it. The fix was animpl Drop for Connectingthat drains and releases.
Two days of soak-and-profile to find them; the diffs themselves are tiny. That's the usual ratio for a leak that only shows up under sustained churn — the finding is the work, the fix is a few lines.
A thank-you to the people who built this
I want to stop and say this plainly, because it's easy to skip past: I got to find these at all only because the whole stack is open. I'm building on iroh and iroh-gossip — peer-to-peer QUIC, NAT traversal, hole-punching, a relay tier, Plumtree/HyParView gossip — none of which I could have written myself in a reasonable lifetime. It's built by the team at n0 (github.com/n0-computer), and the quality of it is the reason my "substrate" is a few hundred lines instead of a few hundred thousand.
And here's the part that still feels lucky every time: when I did hit real bugs deep in that stack, I could read the exact code, instrument it, prove the fault, and send a fix back — and there's a real, responsive community on the other end to receive it. That's not how it goes with a closed black box, where the best you can do is file a ticket into the void and build a workaround. The n0 folks have done years of genuinely hard systems work — the kind where a single select! arm or a missing Drop is the difference between flat and climbing memory — and they gave it away so the rest of us can stand on it. An enormous high-five to that whole team. We are extraordinarily fortunate to have makers like this, working in the open, on infrastructure this good. Thank you.
What I'd tell a team
- Instrument before you theorize. A spawned-versus-finished counter found in minutes what hours of reading the reap path missed. If a resource leaks, count the thing being created and the thing being destroyed before you reason about why.
Some(x) = exprin aselect!arm is a footgun wheneverexprcan legitimately yieldNone. The failed match disables the branch instead of surfacing the close. Bind the value plainly and match it yourself.- Leaks travel in packs. Fixing the dominant one just unmasks the next. Profile again after every fix — the flat line you were hoping for is usually one more leak away.
- Telemetry is not free. Events recorded inside a never-closing span live exactly as long as the span. A long-lived actor span at
DEBUGis an unbounded buffer wearing a tracing label. - Sometimes it is the library — and that's a contribution, not a complaint. I went in assuming the bug was mine, because it usually is. This time the dominant leak was in the stack itself, and the right ending wasn't a workaround in my code — it was a handful of small fixes submitted upstream so nobody else hits it. A leak found under your churn is worth fixing at the source.
What's next
The substrate is finally flat under churn — for real this time, measured, on both platforms. The fixes are upstreamed and the foundation holds. Which means I can stop poking at the substrate's memory behavior and turn back to the thing this notebook is actually about: making a multi-mesh fabric observable and correct, one sprint at a time.
 Part 08 of 16
 Watching a node boot, then a second mesh with no bridge
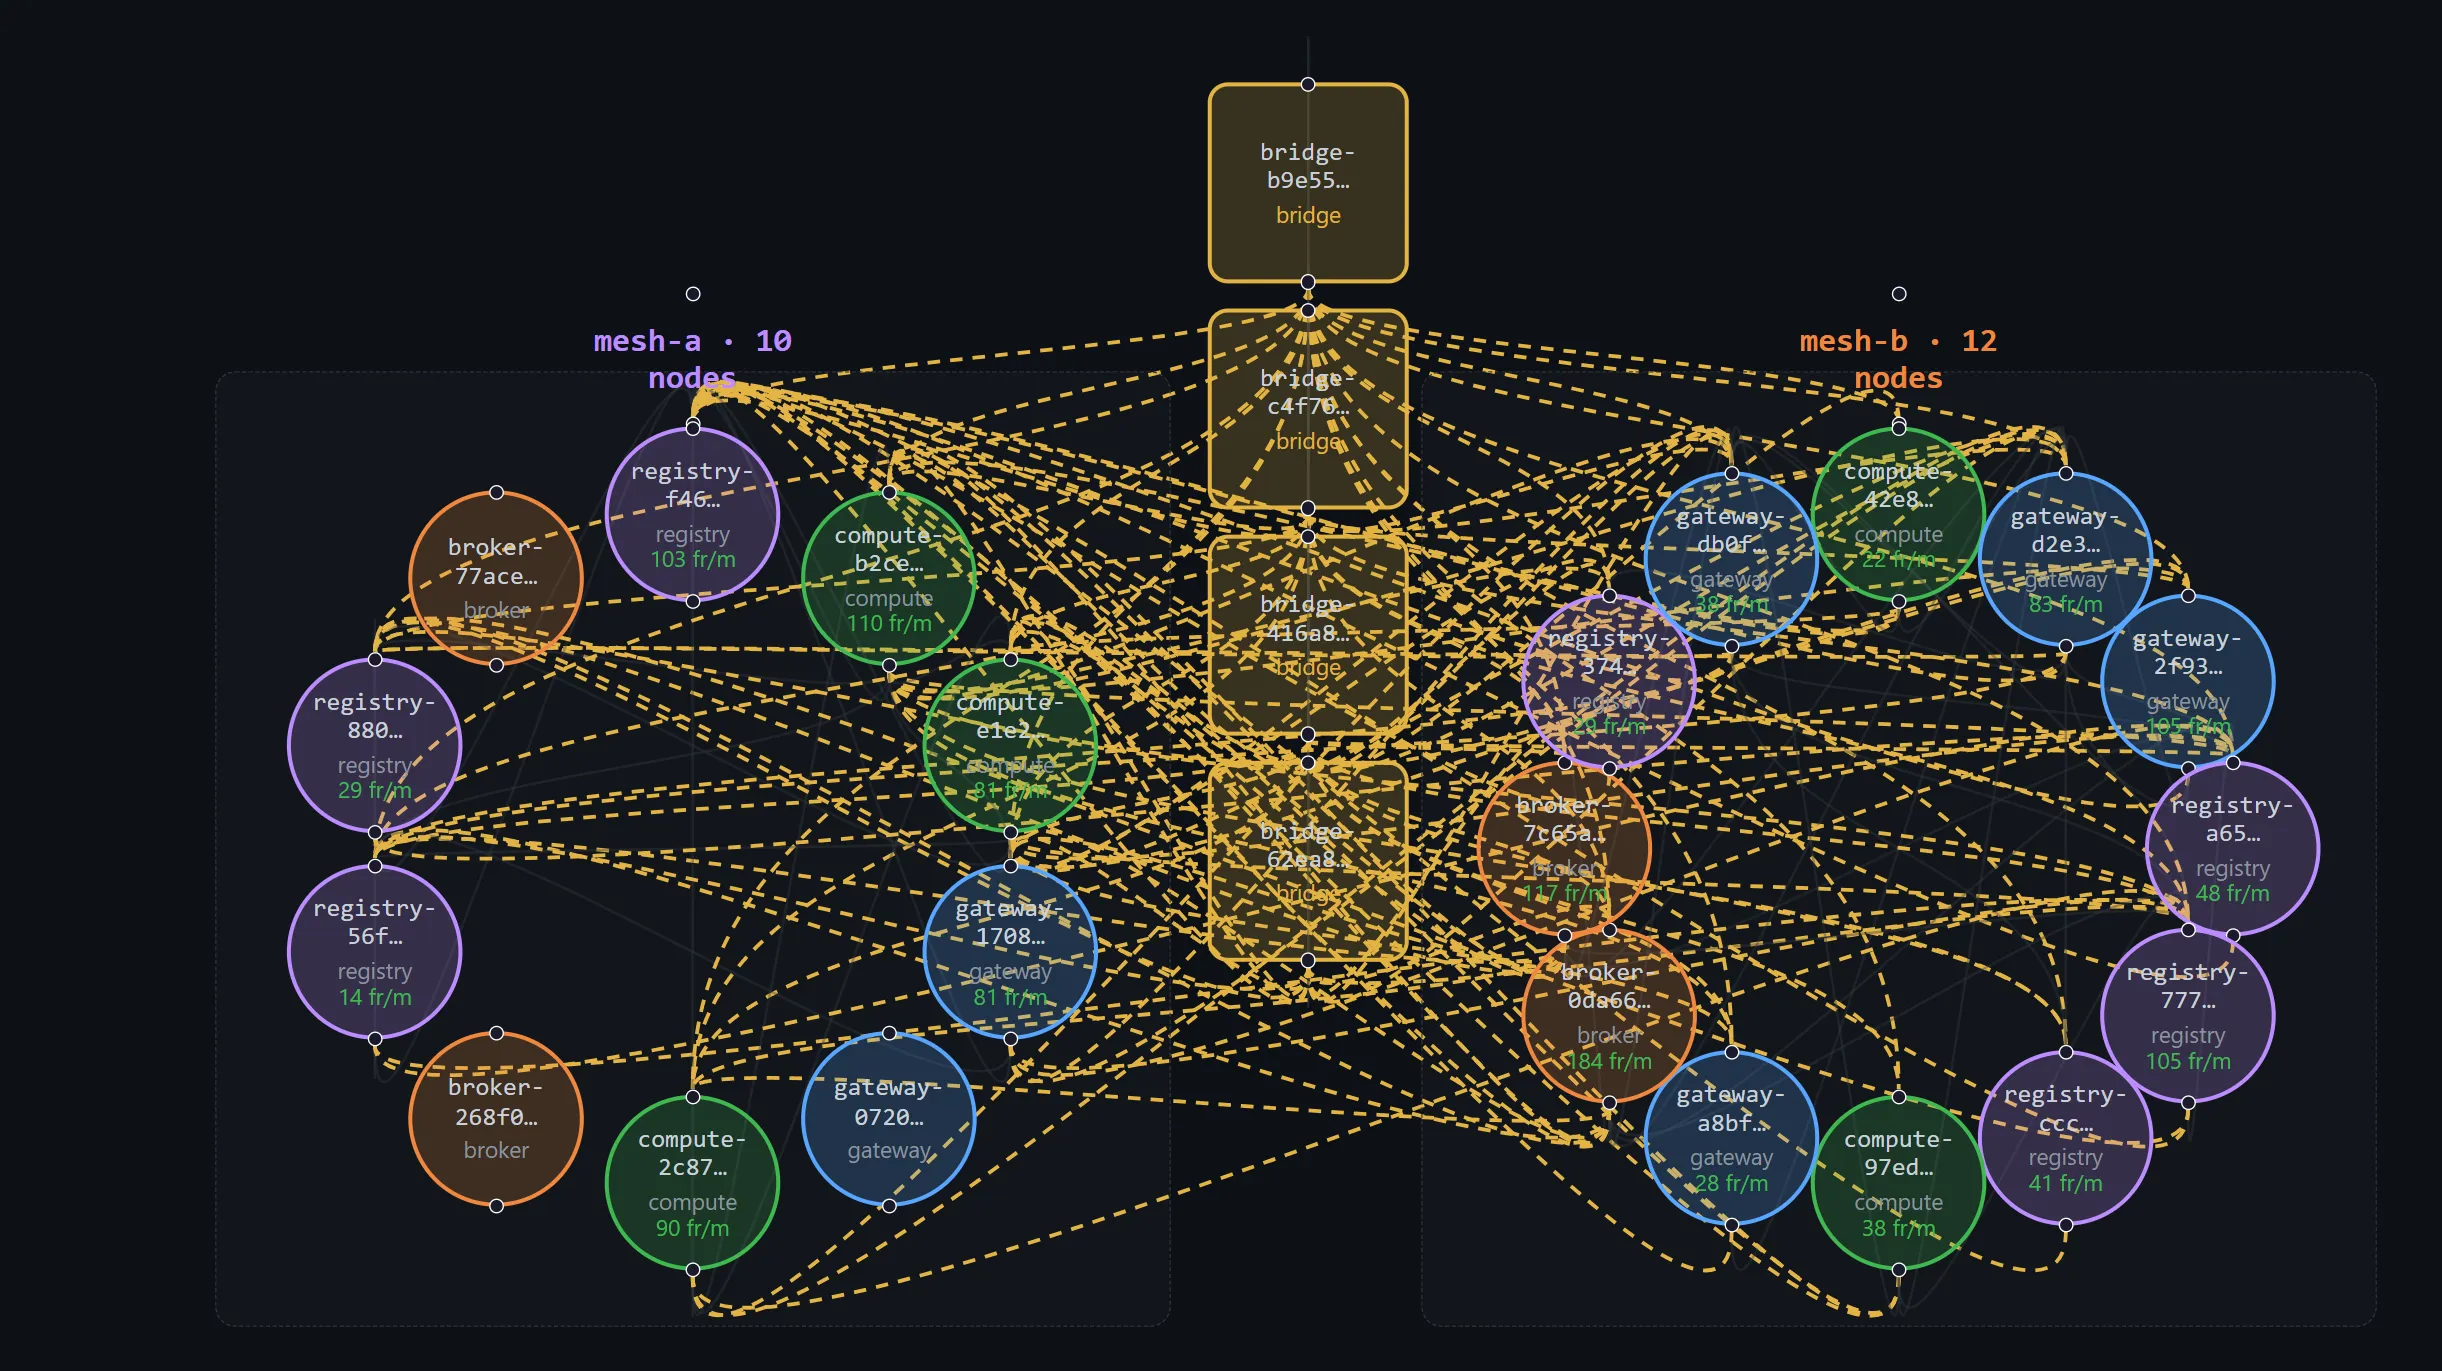
The substrate gets a second life as a multi-mesh fabric — and the rule from day one is telemetry is the substrate, not a feature. A node that does work without leaving a trace is a bug. Here's a node naming itself, booting as a span chain you can read in Jaeger, building a topology directory out of gossip — and then a second mesh reached with no bridge node at all. Every claim is a screenshot of the live system.
The performance work earlier in this notebook left me with a substrate that idles when it has nothing to do and stays flat under churn. That was the foundation. This post starts the thing it was a foundation for: a small, observable multi-mesh fabric — named nodes in named meshes, a gossiped directory so any node can find any other, and not one line of bespoke infrastructure I could get from the library instead.
The rule I set on day one and never relaxed: telemetry is the substrate, not a feature. A node that does work without leaving a trace is a bug. So before there was any "product," there was a boot-span chain and a Jaeger instance to read it in.
A node names itself
When you spawn a broker into mesh1, it doesn't get a random hex id and it isn't named by some central authority. It loads (or mints) its own identity, then self-names from it:
node_name = <mesh>.<type>.<first-6-hex-of-node-id> e.g. mesh1.broker.239dc9
The mesh is required — an unlabelled node fails fast — the type is what it is, and the suffix is the first 6 hex of the node's public key, so the friendly name is eyeball-matchable to its unique id. No registry hands out names; identity is the name.
The boot is a span chain
Every boot is one trace rooted at node.ready, with the bring-up steps as children — endpoint_created → alpn_registered → gossip_started → accept_loop_started, each a few hundred microseconds, all under one root. If a node is misbehaving, the trace tells you exactly how far it got before it stalled.
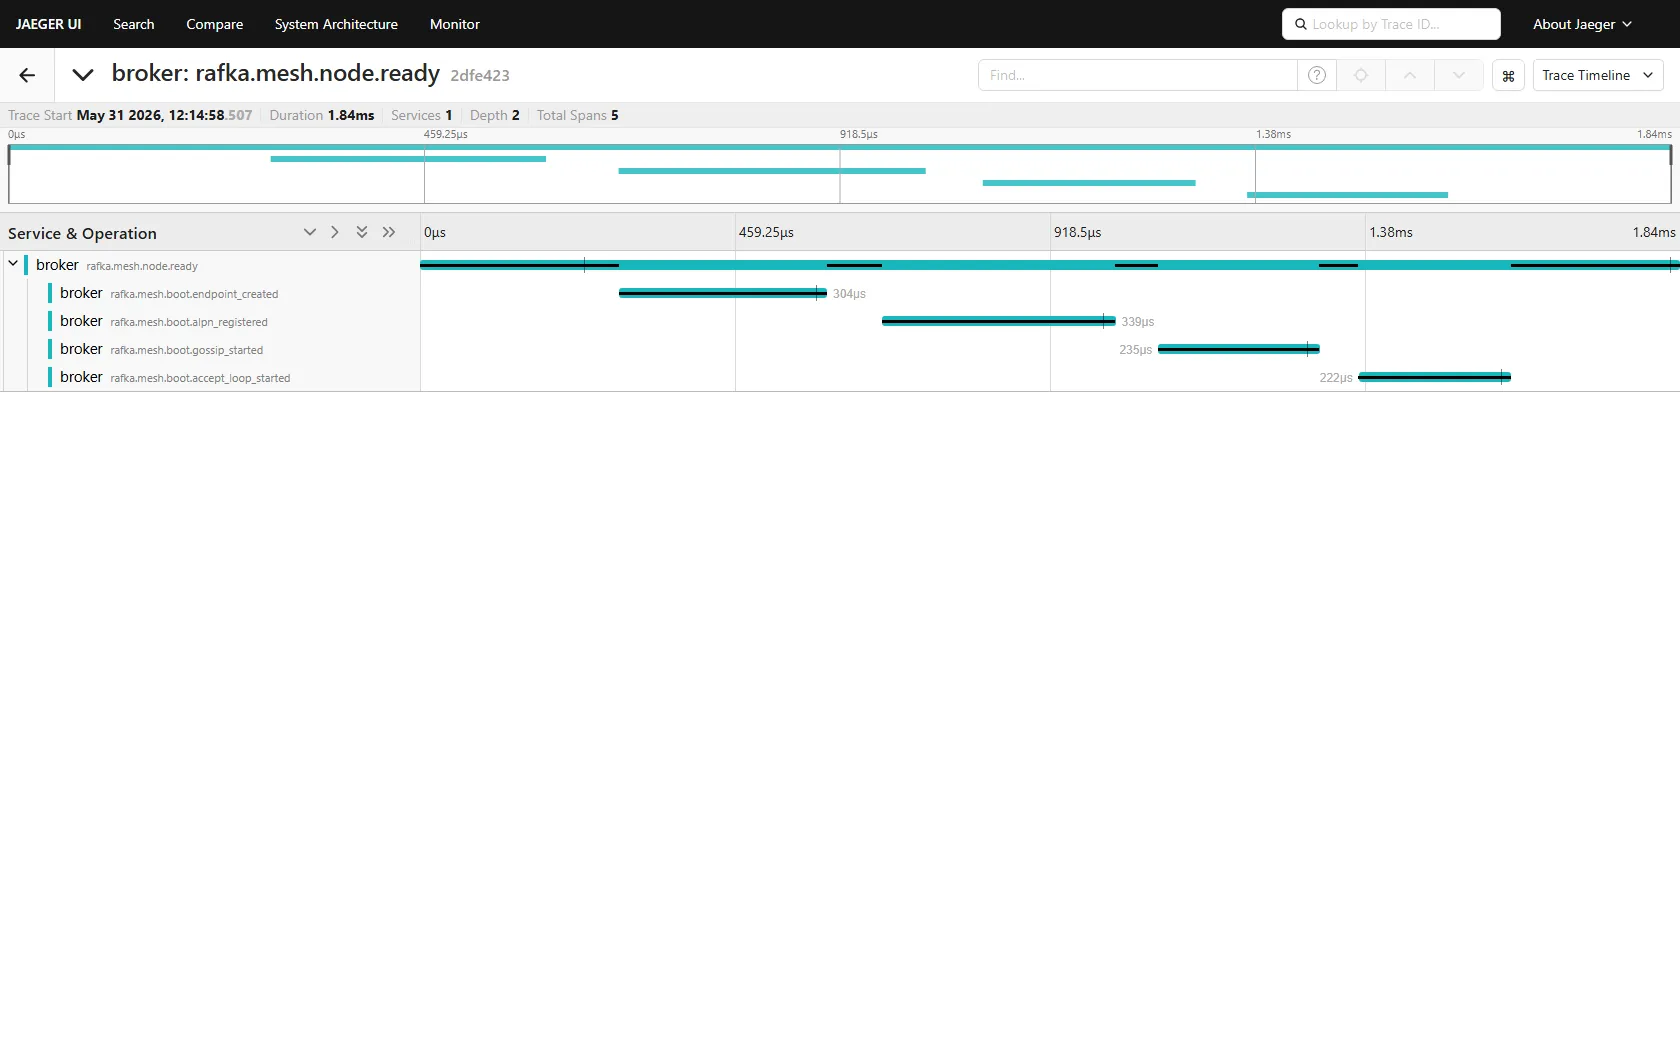
This is the spine. Get the boot chain visible for one node and you can always answer "did it start, and how far did it get" without attaching a debugger.
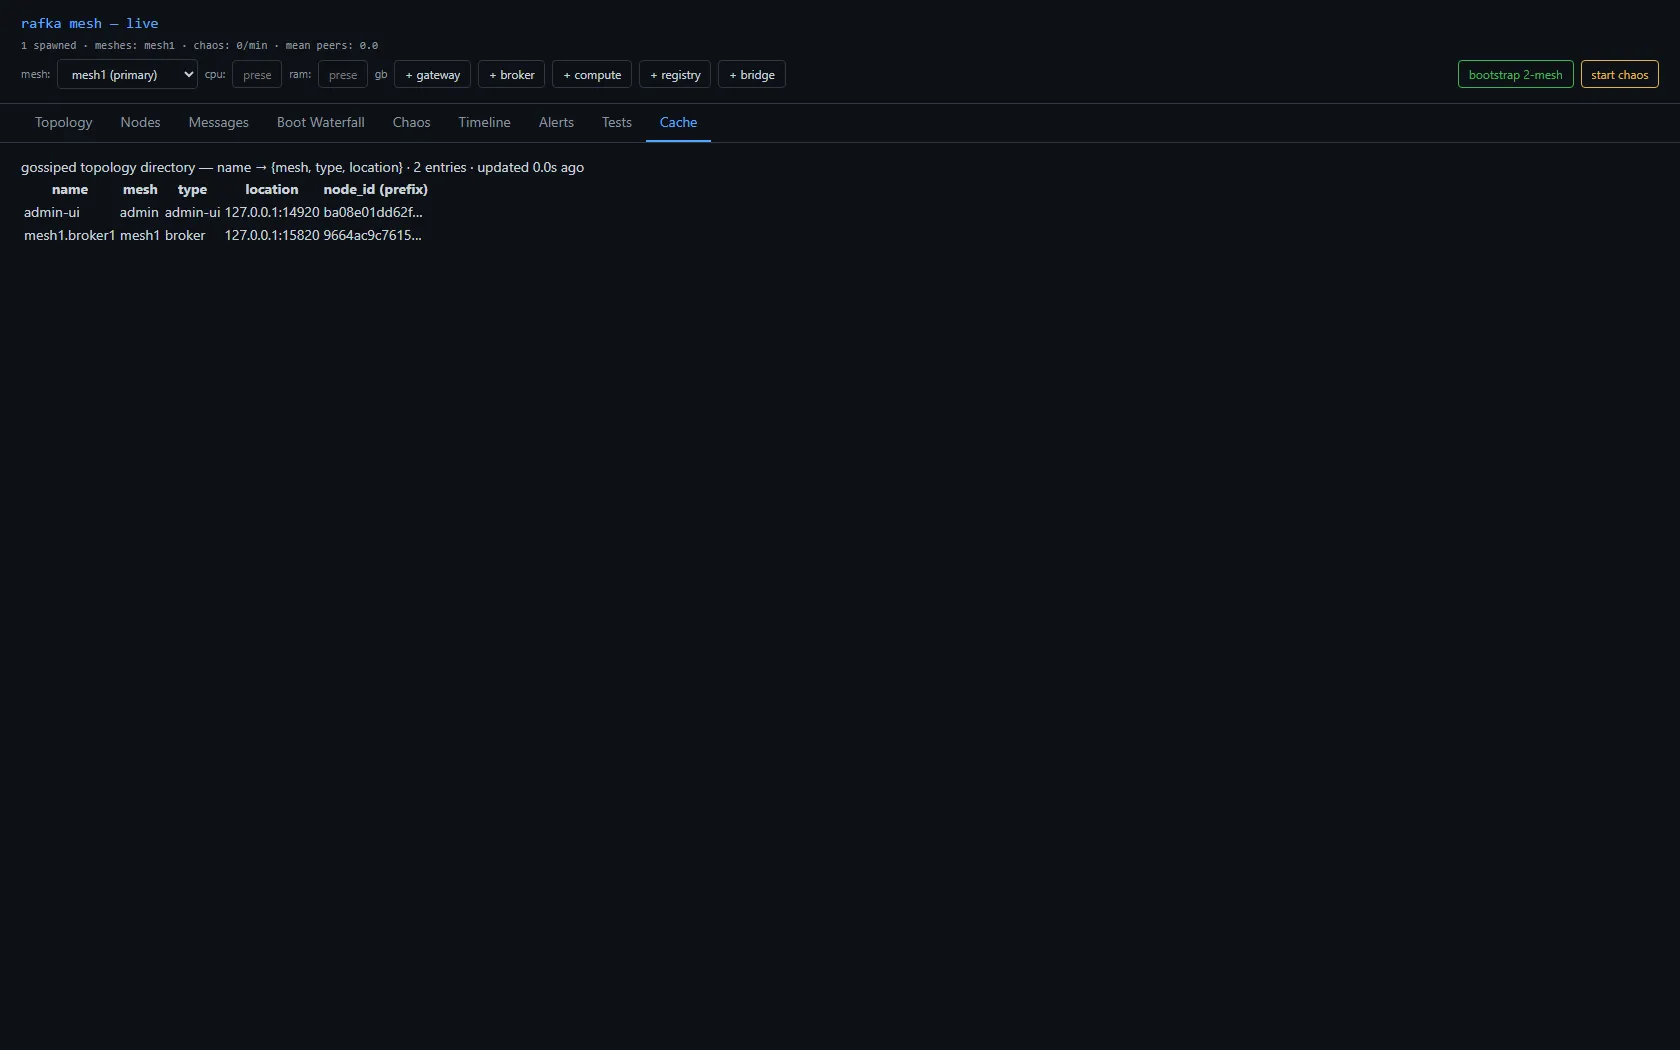
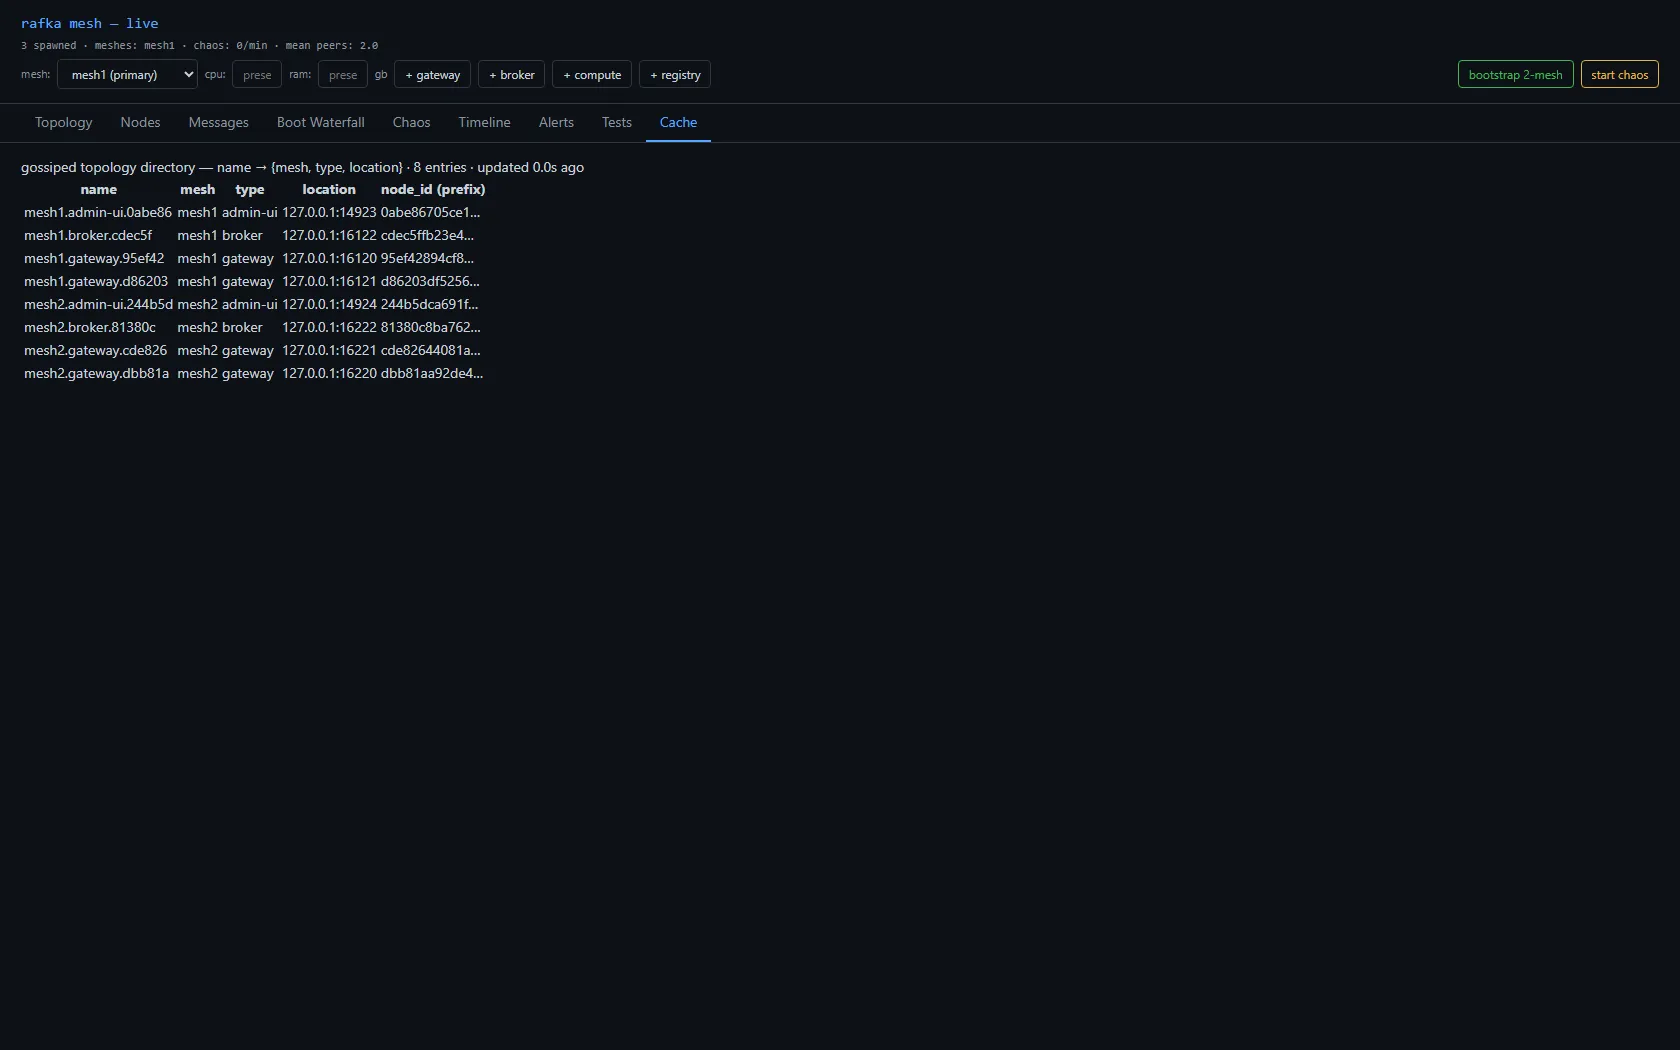
A topology cache, built from gossip
Each node broadcasts a small digest on its mesh's gossip topic, including its reachable address. Every node accumulates those into a process-local directory — name → {mesh, type, location} — surfaced as a Cache view. This is the thing a node consults to answer "where do I send to reach X?" There's no second gossip system and no database: the cache is the gossip digests, surfaced.
A second mesh — and deleting the bridge
The earlier design had a bridge: a special node that joined two meshes' gossip and shuttled awareness between them. It's the obvious first idea, and it's the wrong one — it's a bespoke piece of mesh infrastructure, and the substrate's whole premise is don't build mesh infrastructure, use the library. So the bridge had to go: out went the bridge node type, its spawn button, its env knobs, the whole crate. Two meshes now run side by side with no node whose only job is to connect them.
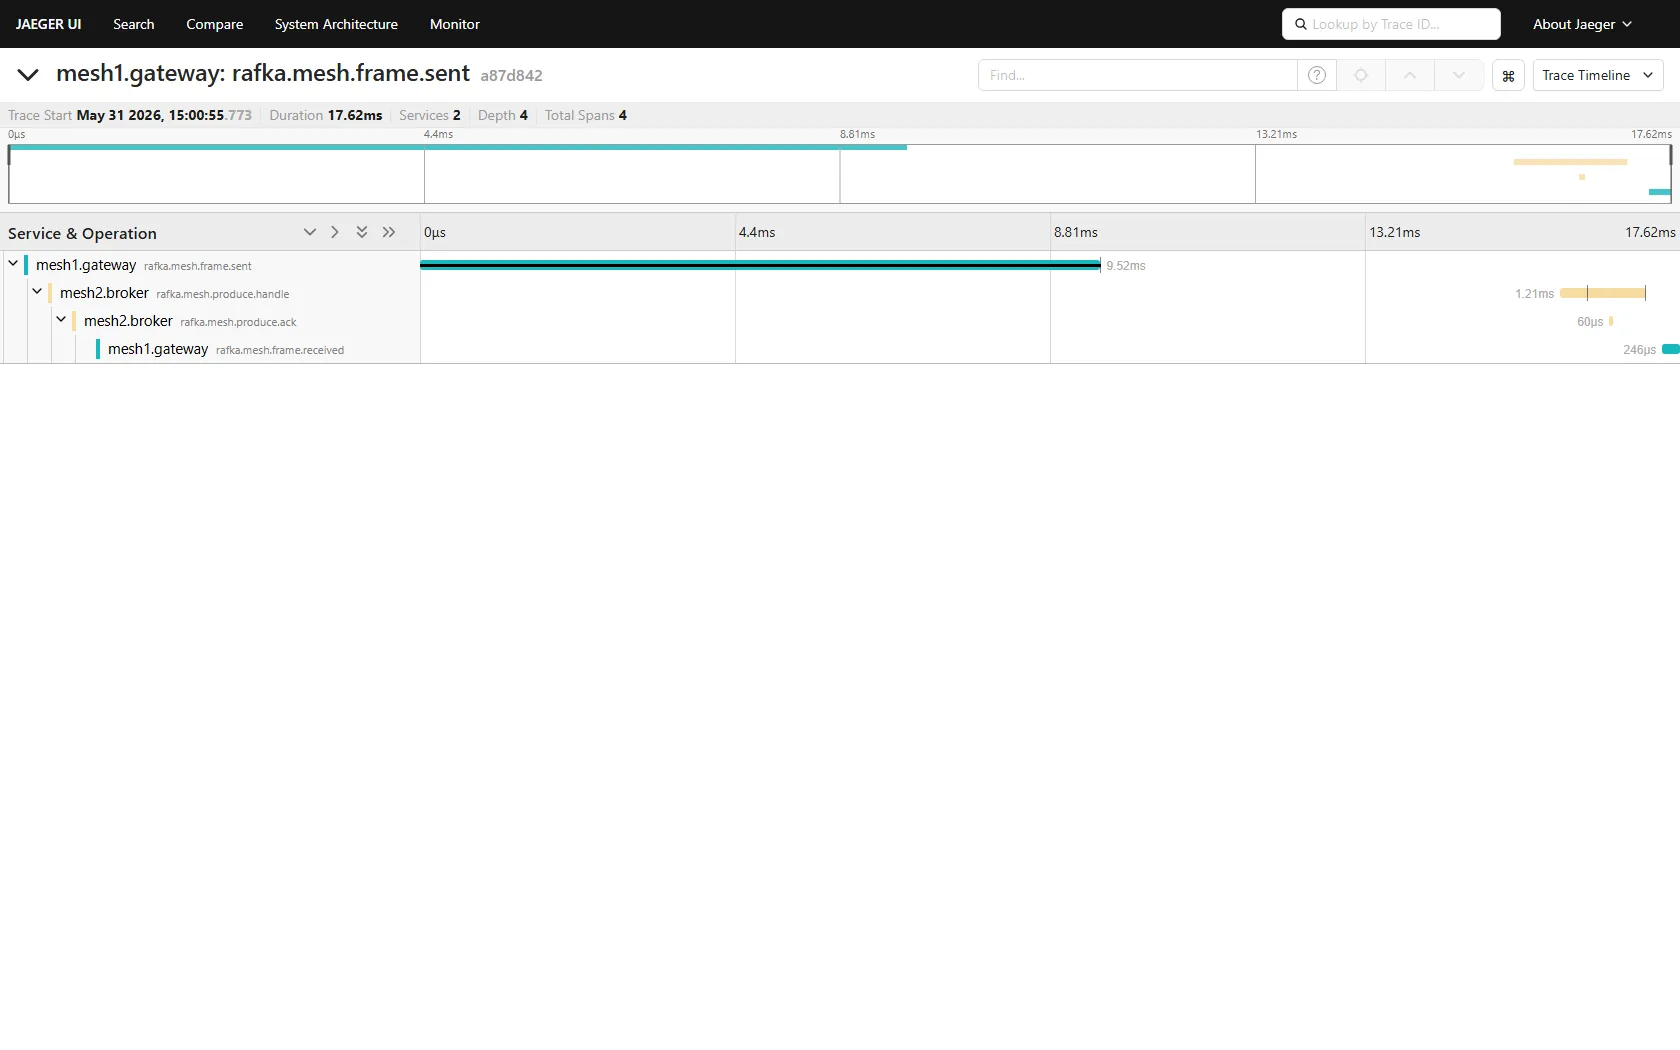
Per-mesh gossip lives on a per-mesh topic (blake3(mesh_id)), so a mesh1 node doesn't see mesh2 by default. The interim answer: the gateway — the node that writes across meshes — also subscribes to the other mesh's gossip, so its directory spans both. A simulated writer on mesh1.gateway resolves mesh2.broker from that directory and sends to it. The proof isn't a line in a log; it's the cross-mesh trace stitching end to end:
The catch (named, not hidden)
"The gateway subscribes to the other mesh's entire gossip" works for two meshes on one host. It does not scale: with many meshes and hundreds of gateways it's an O(meshes²) firehose of every remote node's per-tick digest, and it quietly forces the console to special-case itself as an all-mesh subscriber. That's a real debt, and the next post pays it down with a proper control-plane backbone — after first fixing something more embarrassing: the traces themselves were lying.
What I'd tell a team
- Make telemetry the floor, not the polish. If "does this node work" can only be answered by reading its logs by hand, you'll be reading logs by hand forever. A boot-span chain is cheap and it's the thing you'll lean on every single debugging session after.
- Let identity be the name. Self-naming from the public key means no allocator, no name collisions, no central authority to be down — and a friendly id you can still match to the real one by eye.
- Refuse the bespoke node. A "bridge" felt necessary and wasn't. Every special node type is infrastructure you now own and operate; reach for the library's primitive before you invent one.
 Part 09 of 16
 Make the cross-mesh view honest
Two meshes and cross-mesh writes — but open Jaeger's dependency graph and it lied three ways: one broker where there were two, arrows that only pointed one direction, and a fake edge to the console. Each lie had a real cause in the spans. Then the deeper fix: replacing the all-subscribe-to-everything firehose with a gossip backbone that scales, so the console stops being a special node.
By the end of the last post there were two meshes and cross-mesh writes. But the moment you opened Jaeger's System Architecture view, it lied to you three different ways. Each lie had a real cause in the spans underneath — and a real fix. Then there was a fourth, structural problem: the way cross-mesh awareness worked didn't scale at all.
Lie 1: "there is one broker"
Every broker reported service.name = "broker". Jaeger keys its dependency graph on service name, so mesh1.broker and mesh2.broker collapsed into a single node — and the two-mesh write I'd just shipped was invisible. The fix is the standard OpenTelemetry resource hierarchy, each derived from the node's own identity at boot:
service.namespace= the mesh (mesh1)service.name=<mesh>.<type>(mesh1.broker) — this is what makes a node in the graphservice.instance.id= the full node id (the unique replica)
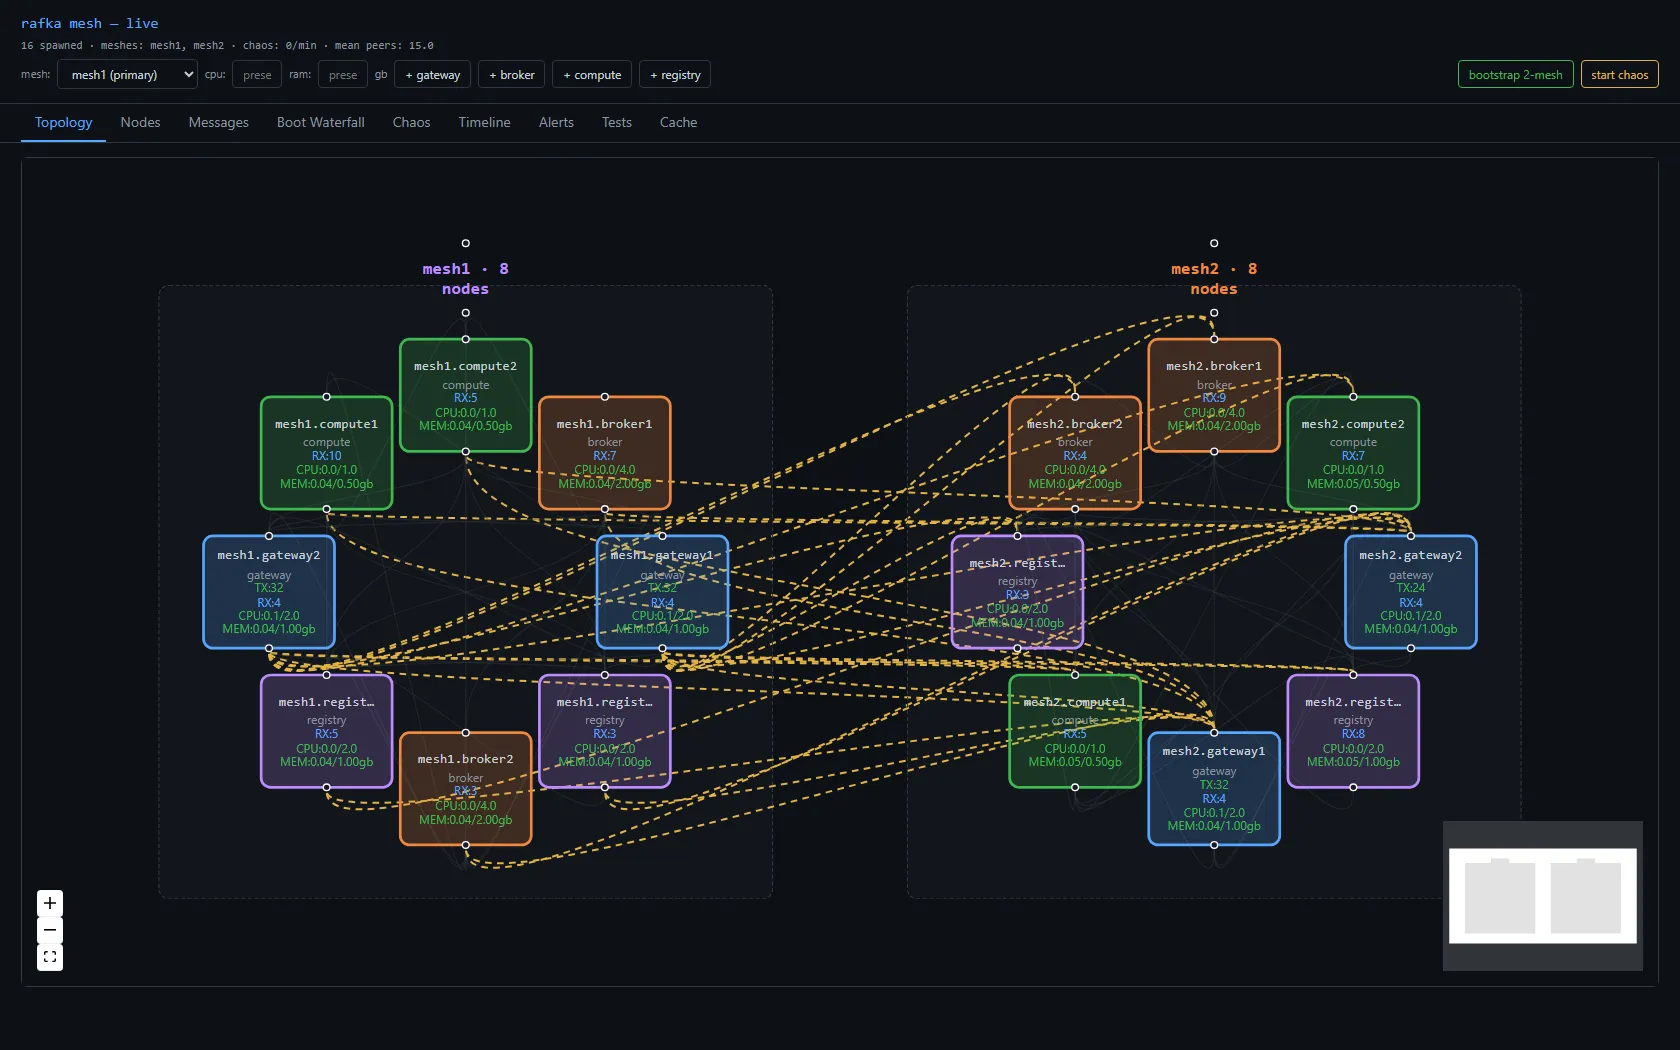
Suddenly the graph has the nodes that actually exist:
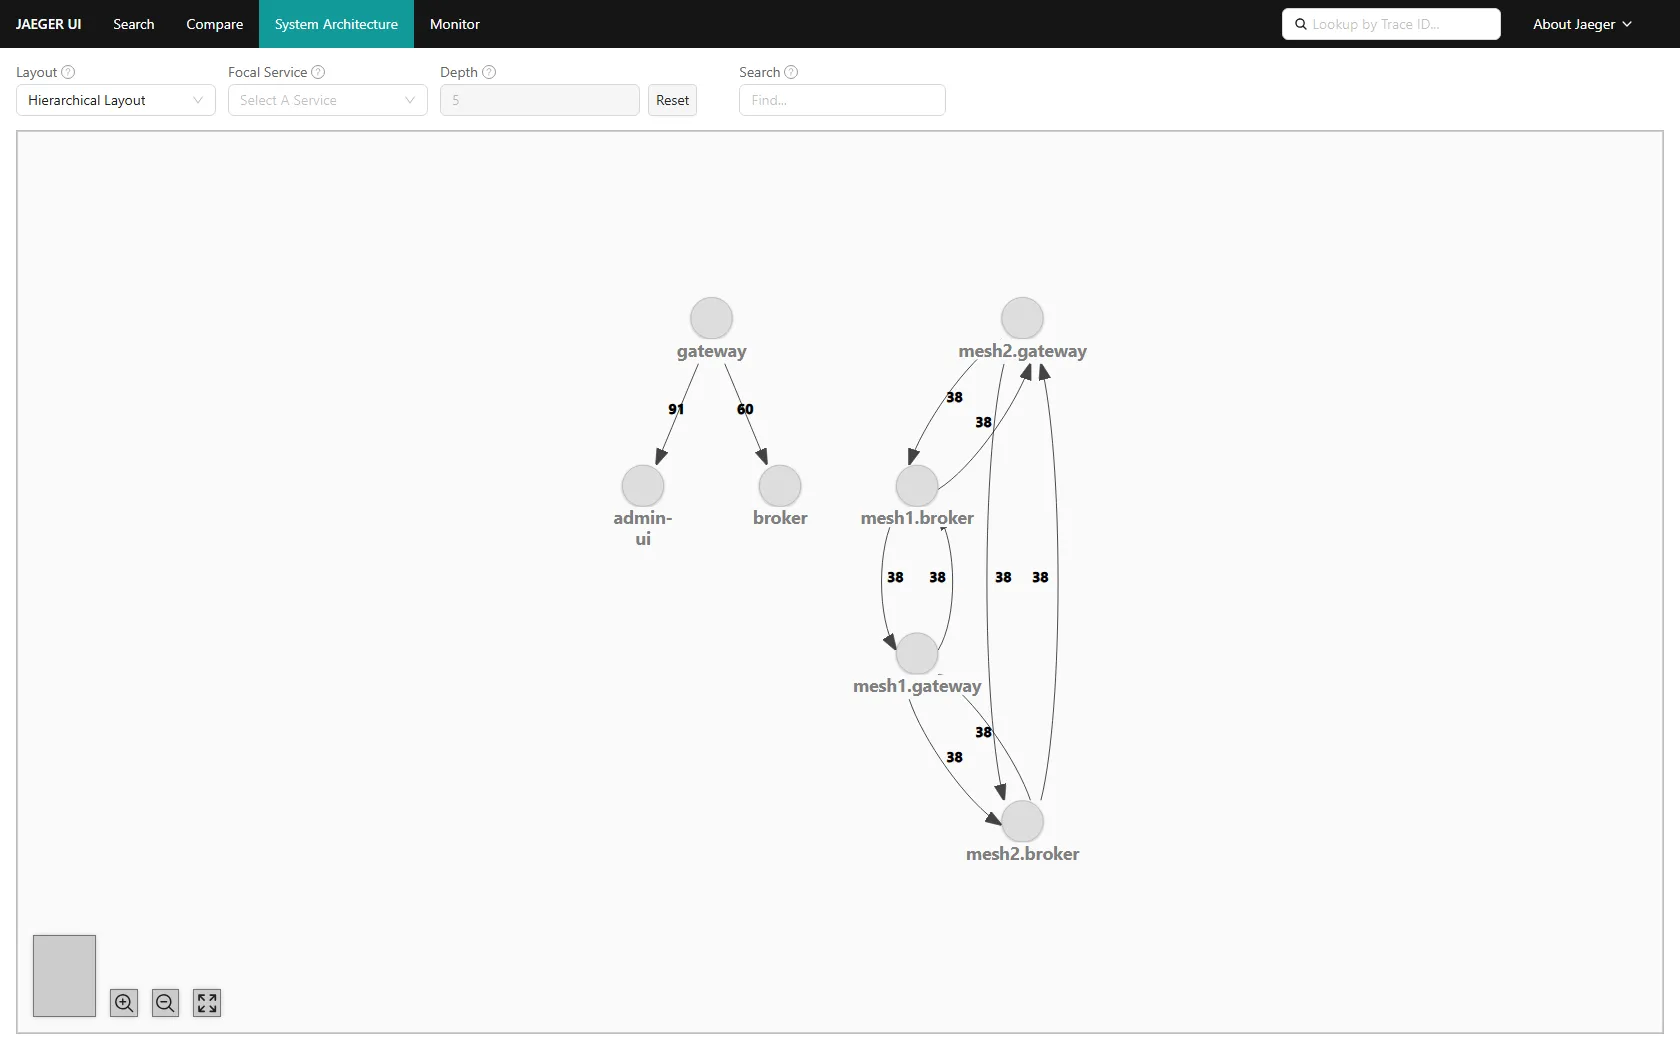
Lie 2: the arrows only point one way
The write was fire-and-forget over a unidirectional stream, so the broker was a pure sink — it received and recorded, but emitted nothing the trace could see. The graph showed gateway → broker and nothing coming back, which isn't what a produce/ack actually is.
Two fixes, one mechanism. First, propagate real W3C trace context across the QUIC frame — I'd been hand-rolling a {trace_id, span_id, flags} struct that dropped tracestate; now it's the standard traceparent/tracestate carrier via the global propagator. Then the broker continues the trace: it extracts the context, opens its own produce.handle span for its work, and sends an ack back. One cross-mesh trace now reads frame.sent → produce.handle → produce.ack → frame.received — the broker's work is in the trace, and the ack gives the reverse edge. Arrows both ways, because the work genuinely goes both ways.
Lie 3: the gateway "talks to" the console
The graph also showed a fat gateway → admin-ui edge. That wasn't data-plane topology at all — the gateway had been cc'ing a copy of every write to the console so a UI tab would be non-empty. A shortcut to light up a panel, masquerading as real traffic. I deleted the cc; the message view now derives from the per-node frame counters already in the gossip digests — a legitimate observation path — and the console stops appearing as a destination for data it never receives.
The rule under all three: a dependency graph is only as honest as the spans beneath it. Fix the emission, not the picture.
The structural problem: awareness that doesn't scale
The last post ended on a confession — "the gateway subscribes to the other mesh's entire gossip" works on a laptop and falls over everywhere else. With many meshes and hundreds of gateways it's an O(meshes²) firehose of every remote node's per-tick digest. Cross-mesh awareness doesn't need every remote heartbeat; it needs a summary. So split the traffic into three planes, all still just iroh:
| plane | channel | carries |
|---|---|---|
| intra-mesh detail | per-mesh gossip blake3(mesh_id) | full per-node digests (stay local) |
| cross-mesh control | backbone topic blake3("backbone") | one summary per mesh: directory + aggregate metrics |
| cross-mesh data | the relay | the actual write frames, when there's no direct path |
The heavy per-node churn never leaves its mesh. Only a thin rollup crosses. Each mesh's gateway already holds its whole mesh via gossip, so aggregating is a local sum — node count, total CPU/RAM, throughput, plus the name → location directory — published as one MeshSummary to the backbone each interval.
One publisher per mesh — without an election
Hundreds of gateways, but exactly one should publish per mesh. No Raft, no bully algorithm — that would be the bespoke infrastructure I keep refusing to build. Instead, a soft lease carried on the backbone itself: the publisher stamps each summary with published_by + expires_at and renews it; other gateways defer to a live claim and only contend for a vacant seat (lowest node id breaks the tie). Leadership changes only when the publisher dies — its claim expires, the next gateway takes over.
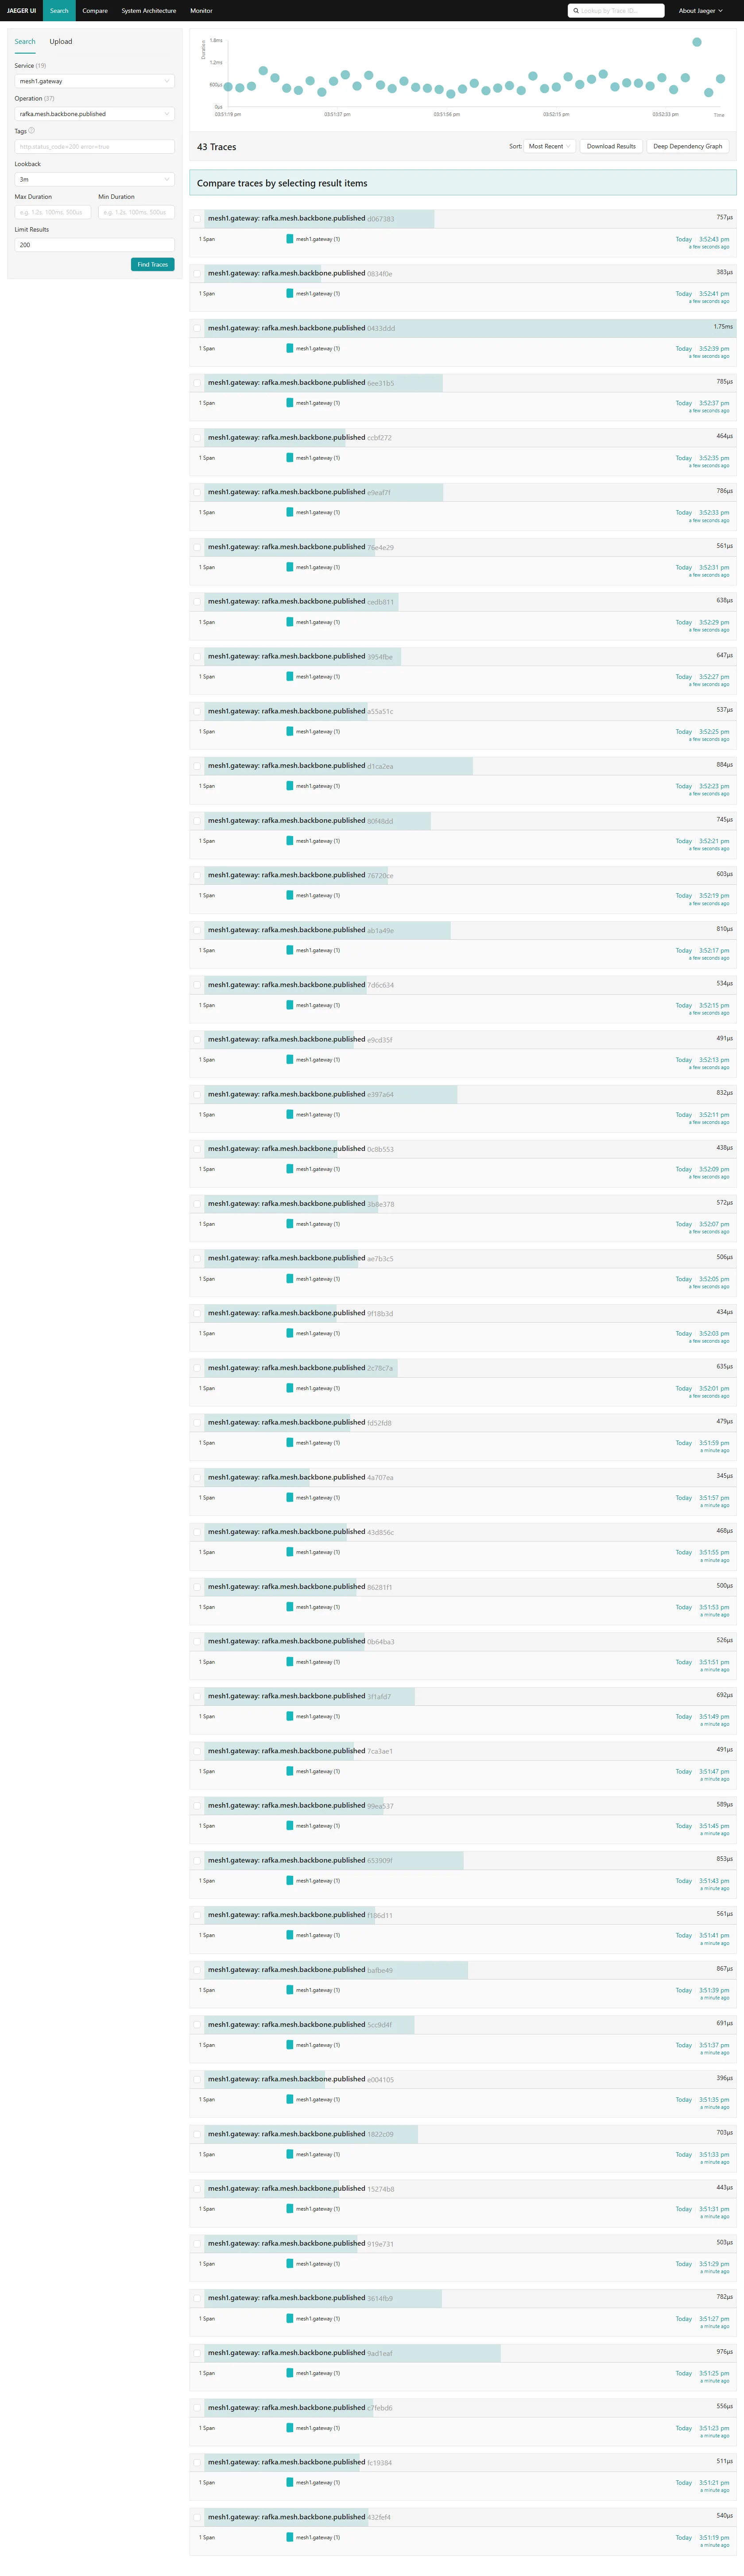
I checked it: across 46 backbone publishes for mesh1 in a 40-minute window, one publisher id. No flapping. The lease holds.
The console becomes a normal node
This is what finally lets the operator console stop being special. It's now a plain node — mesh1.admin-ui.<hex>, a real mesh, self-named — that sees its home mesh in full detail (gossip) and every other mesh as a summary (backbone). Want full per-node detail of another mesh? Run a console in that mesh.
What I'd tell a team
- Trust the graph only as far as the spans earn it. Every lie here looked like a topology bug and was really an emission bug — a coarse service name, a silent sink, a debug cc. Read what your services actually emit before you believe what the dashboard draws.
- Propagate standard context, don't hand-roll it. The home-grown
{trace_id, span_id}struct droppedtracestateand broke continuation.traceparent/tracestatevia the global propagator is five lines and it's correct. - A summary plane beats an all-subscribe firehose. One backbone topic carrying per-mesh rollups, published under a soft lease, replaces O(meshes²) cross-subscription, scales past hundreds of gateways, and removes the last excuse for a "special" node. No DHT, no consensus — one extra gossip topic.
 Part 10 of 16
 The relay is a postbox, not a peer
Two nodes in different meshes know each other's address — but knowing an address isn't reaching it. Behind a NAT there's often no direct path. That's what a relay is for: not a node, not a peer, a dumb postbox that forwards sealed packets it can't read. Here's how the fallback works, why the relay can't see your traffic, and how to prove it actually carries when there's no direct route — without faking the test.
Earlier posts solved awareness: a mesh1 gateway can find out where a mesh2 broker lives, by key, through gossip and the cross-mesh backbone. But knowing an address isn't reaching it. On a real network the two nodes are often behind NATs or firewalls that won't accept an unsolicited inbound connection. That's what the relay is for — and the whole point of this post is that a relay is not a node, and being careful about what it actually is keeps the architecture honest.
Direct when possible, relay when not
The relay is not something I built — it's iroh's, and that's deliberate. The substrate's whole premise is use the library, don't hand-roll mesh infrastructure. The behaviour is iroh-native:
- a connection starts over the relay (the one path that's reliably reachable),
- iroh then tries to hole-punch a direct path in parallel,
- if direct works, it migrates to direct; if it never works, it just stays on the relay.
So "relay is the fallback" really means the connection stays on the relay when the direct upgrade can't be made. Nodes direct-connect when they can; the relay is there when they can't.

Why the relay ever has "better luck" than direct
It doesn't have magic — it has structural luck. Direct peer-to-peer fails under symmetric NAT or restrictive firewalls because neither side will accept an unsolicited inbound connection. The relay is a publicly reachable rendezvous both sides connect outbound to, and outbound is almost always allowed. So A → relay → B works when A → B directly doesn't. That's the whole and only advantage.
The flip side: on localhost — every node a process on one box — there's no NAT and no firewall, so direct always works and the relay sits idle. That isn't a bug; it's the system working. The relay only earns its keep across real network boundaries — which, as we'll see, is exactly why a localhost test can't prove it carries anything.
A relay is a server, not a node
It's natural to think of the relay as "just another node in the mesh." It isn't, and the distinction is load-bearing:
- A node participates in the application. It gossips, it holds data, it has a role — gateway, broker, console.
- A relay is transport-layer plumbing. It coordinates hole-punching and, when a direct connection can't be formed, forwards opaque encrypted packets between two endpoints. It is semantic-blind: it has no idea what a mesh or a message is. In WebRTC terms, it's TURN/STUN, not a peer.
It's the iroh-relay binary, addressed purely by a URL (the one piece of this whole system with a hostname) — while every node is addressed by its public key. It doesn't run our code, doesn't join gossip, doesn't know what a mesh is. It has to live somewhere both meshes can reach outbound — a cloud VM, a DMZ host, an edge box — outside any single mesh's NAT. One relay can serve many meshes; for HA you run a few, geo-distributed, and each node uses its nearest. So a relay is infrastructure you run, not a peer you join.

The part that matters: the relay can't read your mail
The relay secures nothing about the conversation — and that's the point. Security is end-to-end between the two nodes, identical whether the path is direct or relayed:
- Identity is the public key. A node's id is its Ed25519 public key. You don't dial an IP, you dial a key — which is why the directory carries the node id and
connectis identity-based. - The peer connection is authenticated by those keys. The end-to-end QUIC/TLS 1.3 handshake proves the remote end holds the private key matching the id you dialed. Same guarantee on a relayed path as a direct one.
- The relay is a dumb forwarder of already-encrypted packets. It sees ciphertext plus the destination key to route on. It can't read the data (it holds no key), can't impersonate either peer (a MITM attempt fails the end-to-end handshake), can't forge or inject.
The subtlety worth keeping straight: there are two separate TLS layers. The node ↔ relay hop uses the relay's own server cert (Let's Encrypt in prod, self-signed in dev) — it only protects the hop to the relay. The node ↔ node channel is the end-to-end QUIC encrypted under the peers' keys, riding inside that. So when a test trusts a dev relay's self-signed cert, peer-to-peer security is untouched — that flag says "trust this dev relay box," not "trust whoever's on the other end." Peer identity is always verified by key.
Honest threat model: a malicious or compromised relay can hurt availability (drop or delay your packets) and observe metadata (which keys talk, when, how much) — but never content or identity. You trust it to forward, not to read or vouch. The keys do the vouching, point to point, direct or relayed alike.
Proving it carries — the obvious proof is a lie
The relay had been plumbing for a while: configured, registered, the path existed. But "the relay works" was an assertion, not a fact, because on one host iroh always picks direct and the relay never carries a byte.
The obvious move to prove carriage: give a node a relay-only address — a relay URL and no direct socket addr — so the only way to reach it is through the relay. Dial it, send bytes, done. That's a lie, and it's the version that had burned me before. It proves the first packet went via relay. It does not prove the relay carries anything: once the QUIC connection is up, the two endpoints exchange their direct addresses over it and hole-punch. On loopback that succeeds in milliseconds, the connection silently upgrades to direct, and any "is it relayed?" check flips to false the moment after you looked. The test either flakes or "passes" by checking before the upgrade — proving connect-via-relay, not relay-carriage.
Make direct impossible
The fix isn't a cleverer assertion — it's removing the alternative. iroh's endpoint builder has .clear_ip_transports(): bind with no IP transport at all. Then a direct hole-punch isn't slow or unlikely, it's impossible — there is no socket to punch. The relay is the only transport that exists, so a delivered byte can only have come one way, and there's no timing window to race.
The whole proof, using iroh's built-in test_utils (cross-platform — no Docker, no WSL, no external network simulator):
run_relay_server()— a real local relay with a self-signed cert.- Two endpoints: a custom relay map, trust the test cert, and
.clear_ip_transports()so no direct path can exist. - The client dials a relay-only address and runs a bi-stream echo.
- Assert two things: the bytes round-trip and the selected QUIC path
.is_relay().
Bytes came back, over a connection that had no direct path to fall back to. That's relay-carriage, and it's deterministic — green three times out of three, no sleep, no retry.
One number fell out of the related path-failover test worth flagging: when a live connection's direct path dies and it has to cut over to the relay, the cutover took ~15 seconds — iroh's QUIC path-death detection timeout. A write in flight when a path dies stalls for that window before it reroutes; writes after it go straight to relay. It's a one-time cutover cost, tunable via the transport's keepalive/idle settings — a knob to weigh against whatever failover target a real deployment needs.
The honest caveat
This runs against test endpoints, not the live production transport. The production transport takes a relay URL as a string, not a relay map, and has no hook to trust a self-signed cert — and bolting an insecure-skip-verify into the real transport just to test it would be exactly the kind of substrate-edit-for-a-test that doesn't earn its keep. A production relay has a real certificate and needs no bypass. So the claim is precise: the substrate can carry a write over the relay when there is no direct path — proven — not "the live mesh was forced onto the relay in the UI." Know which sentence your green checkmark is under.
What I'd tell a team
- Name the relay correctly and the architecture stays clean. Call it "a node" and you'll be tempted to give it application knowledge, gossip state, a role. Call it what it is — a semantic-blind packet mover — and it stays out of the data-routing logic where it belongs.
- Two TLS layers, two different trusts. "Trust this dev relay" and "trust the peer on the other end" are separate decisions. Conflating them is how people convince themselves a test is insecure when it isn't — or that it's secure when it isn't.
- Refuse to let "the test passed" stand in for "the test checks the thing." The relay-only-address proof passes green on loopback and proves the wrong claim. The discipline that mattered wasn't iroh knowledge — it was writing down the failure mode ("relay-only controls how you first reach the peer, not which path carries traffic after") before coding, where it's obviously not a proof.
What's next
The relay carries, provably, when there's no direct path — and it can't read what it carries. The substrate now has a NAT-traversal story that holds end to end. Next I make "kill that node" a mesh operation instead of an OS one, and turn a node's whole lifecycle into something the mesh broadcasts.
 Part 11 of 16
 Kill by message, not by ownership — and a node is a state
The console could only kill nodes it had personally spawned — process ownership deciding who can operate on what, which is backwards for a self-aware fleet. So a kill became a message any participant can send, and a node's whole lifecycle became something the mesh broadcasts: Joining, Alive, Degraded, Updating, Draining, Leaving, Dead. Plus the most expensive lesson of the sprint, which wasn't in the mesh at all.
The console could kill nodes. Sort of. It worked by holding the OS child handle of every process it had spawned and calling TerminateProcess — which means a console could only kill its own spawns, not a node it merely saw in another mesh. That's backwards for a self-aware fleet: which OS process happens to own a node should have nothing to do with who can operate on it.
A kill is a message
So a kill became a control op. Any participant — including a console in a different mesh — sends the target a Shutdown frame over the mesh (direct or via the relay). The target receives it, shuts itself down gracefully (emits node.stopping, broadcasts its own tombstone), and exits. The caller resolves the target's address from what it can already see — its own gossip, the cross-mesh backbone directory, or its spawn registry — and dials it. No process ownership anywhere.
The proof: from the mesh1 console, kill a mesh2 gateway the mesh1 console never spawned. The gateway process dies, and it disappears from both consoles immediately. mesh1 commanded it; it didn't own it.
A node is a node
While wiring that up, a sharper question: a console is in a mesh — why doesn't its mesh show up to other consoles? Because only gateways published a mesh's summary to the backbone, and the console was a subscribe-only observer. So a mesh whose only node was its console was invisible cross-mesh.
A node is a node. The console now publishes too — it's a backbone publisher candidate alongside gateways, and the soft lease still elects exactly one publisher per mesh. So every mesh advertises itself, even a bare console. Both consoles show both meshes whether or not either has a gateway — and I test that with a deliberately non-balanced fleet, because a symmetric one can pass on coincidence.
A node is a state
The tombstone proved a nice pattern: broadcast "this node is gone" as an event and everyone evicts instantly — no waiting for a timeout. The natural generalization is to make the whole lifecycle an event. Not a binary join/leave, but a state:
Joining · Alive · Degraded · Updating · Draining · Leaving · Dead
A node publishes its own lifecycle on every transition; Leaving is the old fast-delete. The one it can't publish is Dead — a crashed node announces nothing — so Dead is what observers assign when a node vanishes without a Leaving. The operator gets the difference for free: "left cleanly" vs "crashed" vs "just rolling an update," instead of everything collapsed into "gone." Live, the topology colors each node by state — a broker mid-Draining, another Degraded and pinned at 100% CPU, the rest Alive:
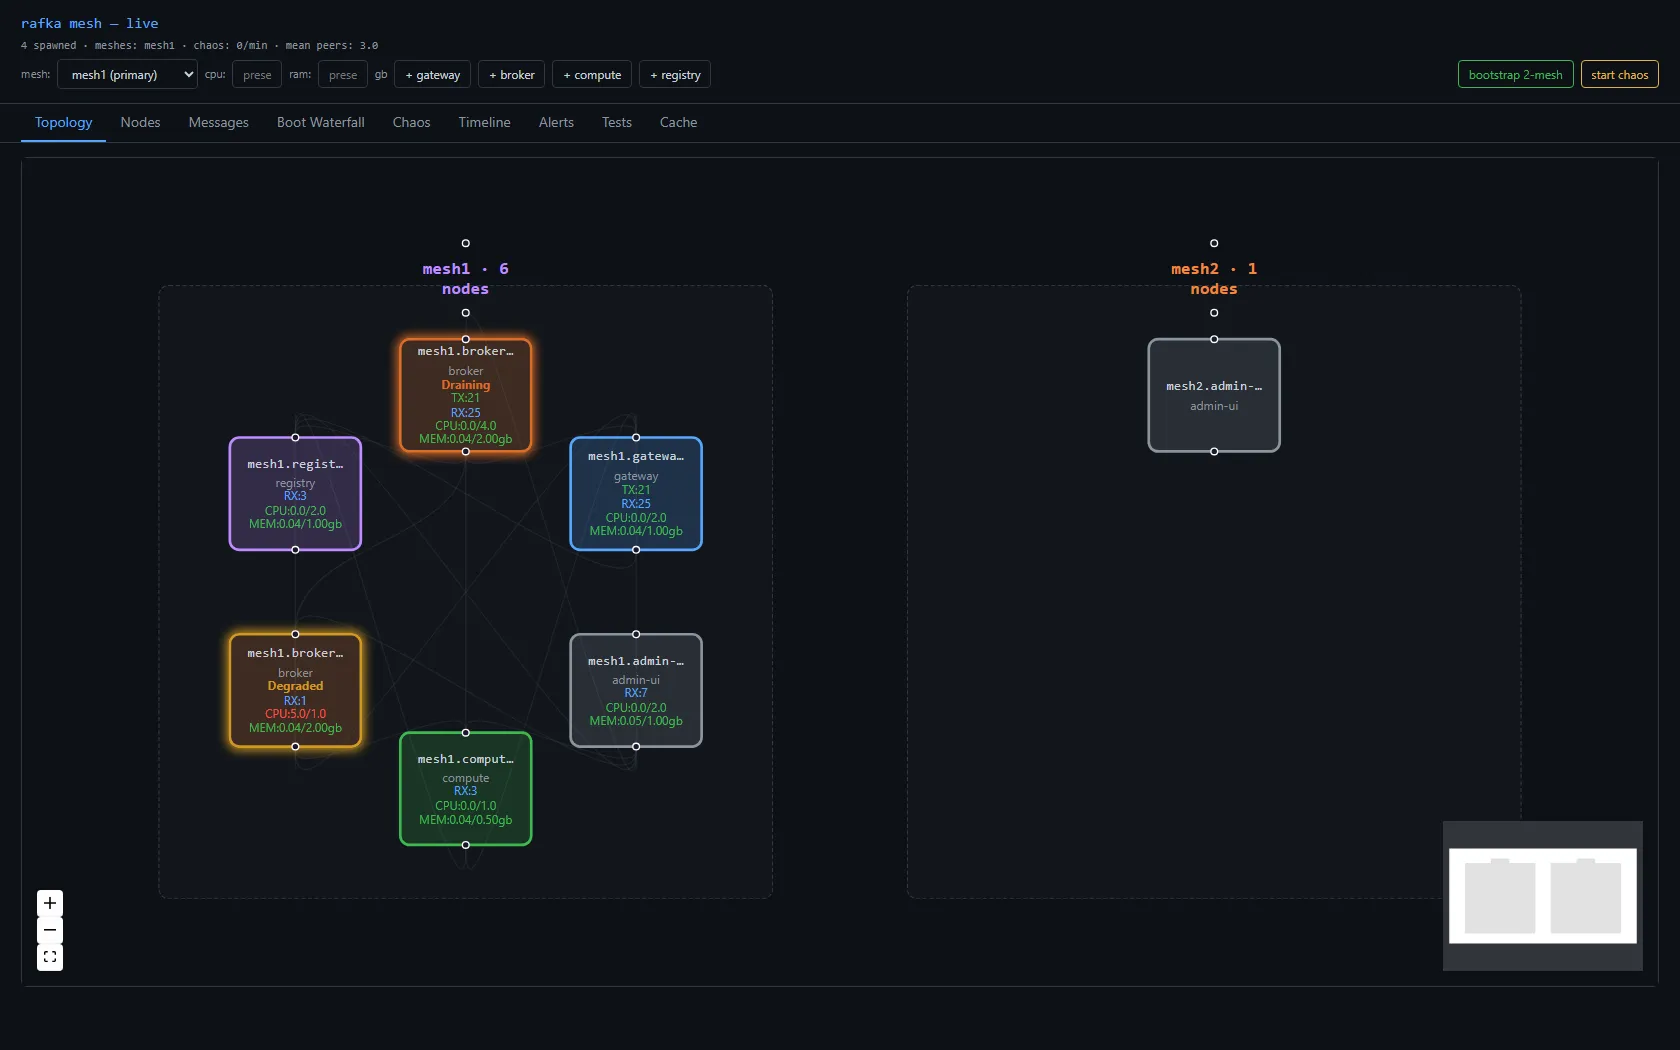
Each node card carries the controls that drive those transitions directly — drain, upd (update), resume, and kill — so an operator moves a node through its lifecycle by message, from any console:
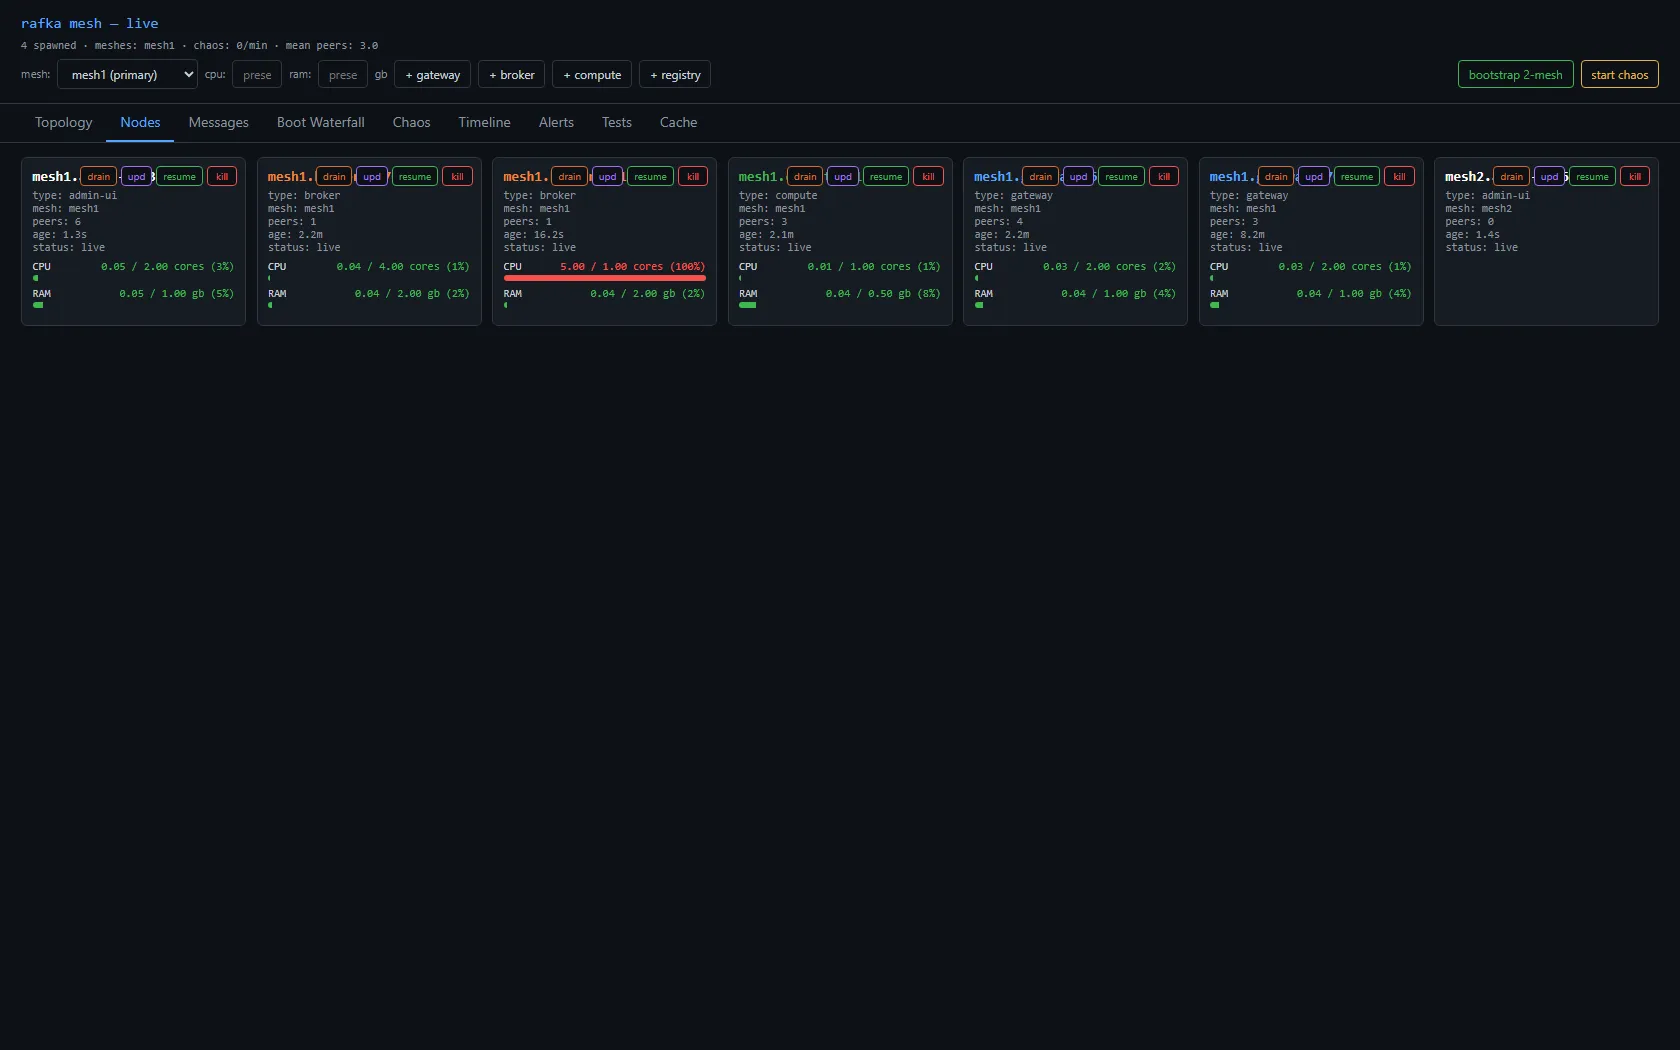
An honesty note, because the order matters. When I first wrote this lifecycle up, I wrote it in the present tense as if it had all shipped — it hadn't. At that point only Leaving/Dead eviction was real (the tombstone). Updating/Draining had no trigger you could reach, and nothing fired on a state change — it was the design, not the system. It became real afterward, in pieces: the enum wire change and observer-inferred Dead first; then a SetState control op to actually drive Updating/Draining; and last, the durable per-transition event — a node.state_changed span on every self-state change — which is what finally makes "publishes its lifecycle on every transition" a true sentence instead of an aspiration. Proven end to end: one node walking Joining → Alive → Updating → Draining as a clean span trail, plus Leaving (kill) and Dead (crash) as distinct tombstone sources. After it leaves or dies, observers evict it and the topology settles back to what's actually alive:
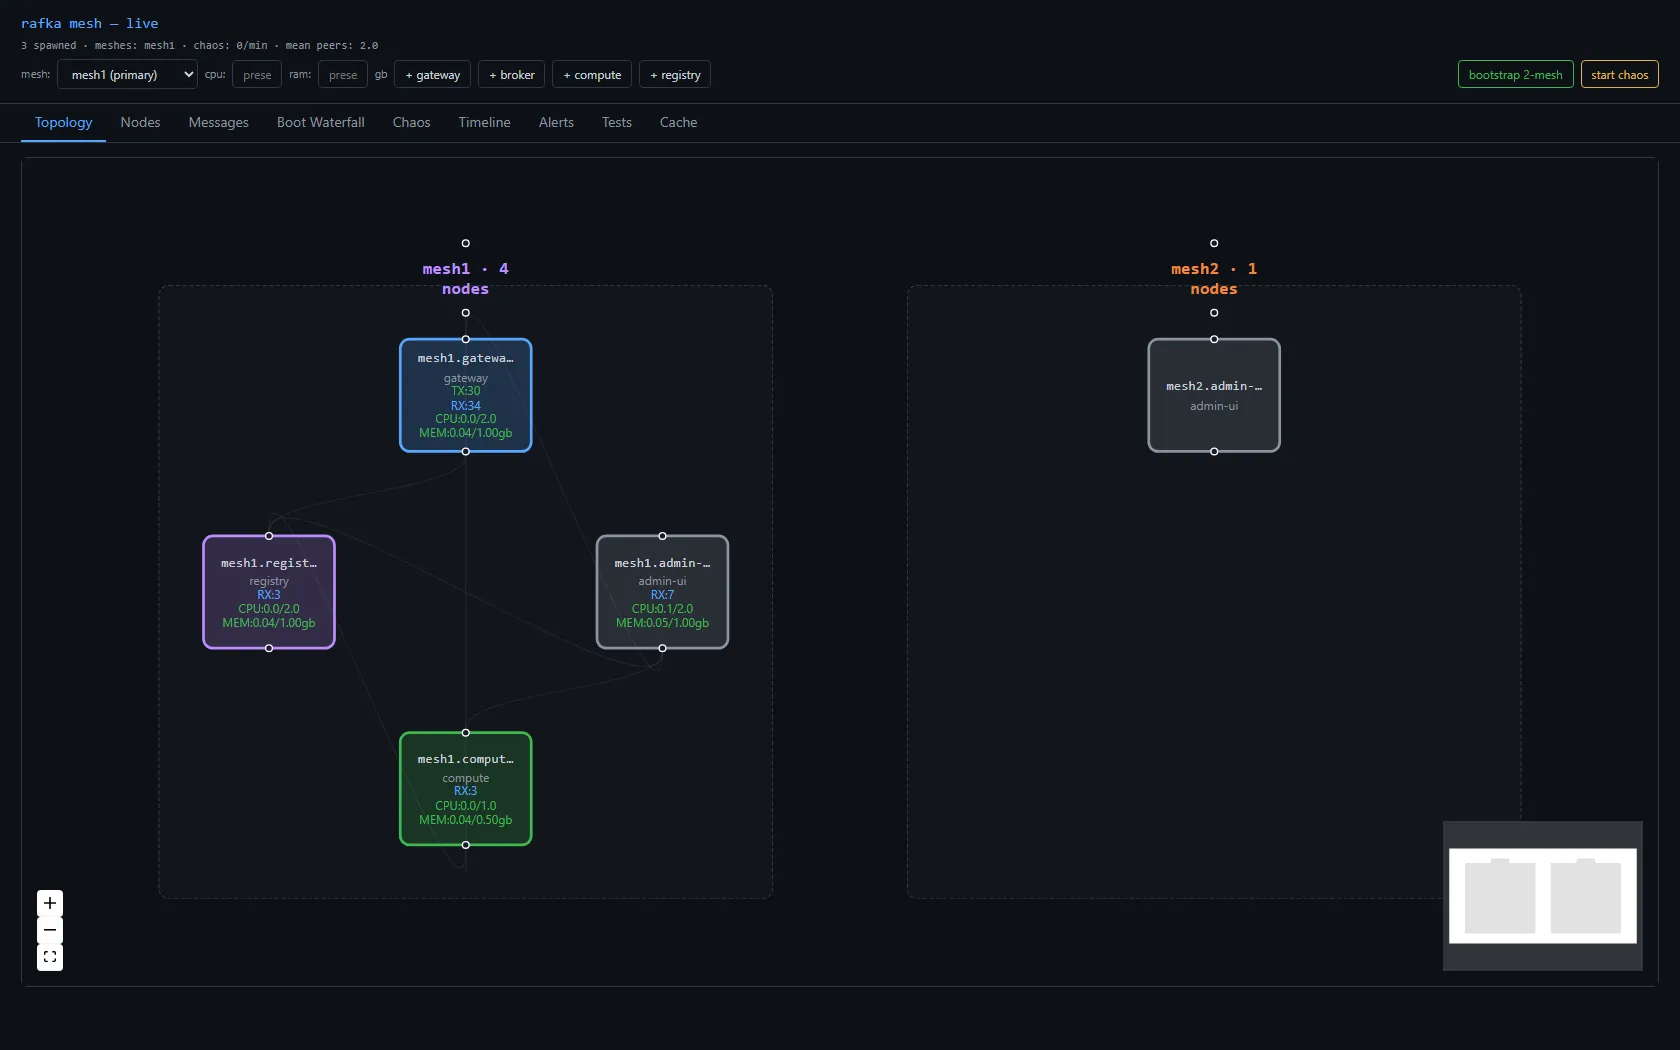
The most expensive lesson (and it wasn't in the mesh)
For hours the cross-mesh view looked broken, and I nearly wrote off two earlier sprints as defective. They weren't. I was testing stale binaries. On Windows a running .exe is file-locked, so rebuilding while a node runs silently leaves the old binary in place — and worse, the console spawns its child nodes from target/debug while I'd been building --release. So the nodes that actually ran were ancient code, broadcasting a wire format the new code couldn't decode. A one-line Get-Process | Select Path showed it instantly, once I stopped trusting "the build succeeded" and started gating on "is the binary I'm about to run actually newer than the source I changed?"
The mesh code was right the whole time. The discipline — kill everything, rebuild, verify the binary is fresh, then conclude — is the part that wasn't. That one's framed on the wall now.
What I'd tell a team
- Authority is a message, not a handle. Tie "who can operate on a node" to a process handle and you've quietly coupled control to deployment topology. A control frame any authorized participant can send decouples them — and works across the relay, which a process handle never could.
- Model lifecycle as a state, and let
Deadbe inferred. A node can announce every transition except its own crash. Make "vanished without a goodbye" meanDead, and the operator gets "crashed vs left vs updating" for nothing. - Write the changelog in the tense that's true. I described a lifecycle as shipped when it was designed, and had to correct it. Present tense is a claim; if the event doesn't fire yet, say "designed," not "does."
- Gate on binary freshness, not build success. "The build succeeded" and "the thing I'm about to run is the thing I just built" are different sentences. On Windows especially, verify the second one before you conclude anything from a test.
 Part 12 of 16
 The bug that wasn't in the mesh
Two cross-mesh 'the mesh is broken' scares in one session. Neither was the mesh. A 40-second join that was a missing address book, and a NeighborUp-then-NeighborDown that was my own bidirectional test setup tripping a latent bug. The lesson is the same both times: trust the live signal over the tidy theory — and the cheapest next move is almost never another change.
Two admin consoles, one per mesh, cross-seeded so each shows both meshes via the backbone. It worked. Then, after a rebuild, each console showed only its own mesh. Classic "what did I break?" — and the answer, twice in one session, was: nothing in the mesh.
Scare one: the 40-second node
Spawned nodes took ~40 seconds to appear, while removals were instant. The asymmetry was the clue: removal is an event (a tombstone), but appearance waited on a node actually joining the gossip swarm — and with mDNS off (it cross-contaminates every node on localhost), a node had no way to resolve the address of a peer it only learned about through gossip. iroh fell back to a discovery lookup that failed and retried. join_peers takes a node id; it needs an address from somewhere.
The fix was not to invent something — it was to stop inventing something. I started hand-rolling a custom AddressLookup, and the reviewer stopped me: iroh already ships MemoryLookup, a manual address book. The gossip digest already carries each node's location. So: register the location into iroh's built-in book on the receive path. Peers resolve directly, no failed lookup, no 40 seconds. The whole fix was populating an existing extension point instead of building a parallel one. (This is the same instinct the n0 team designs for — the library nearly always has the hook already; the work is finding it, not replacing it.)
Scare two: NeighborUp, then NeighborDown
Convergence fixed, the cross-mesh view still broke on fresh restart. I had a tidy theory — "the address lookup races the join" — and I wrote it into the report as the root cause. It was wrong, and my own data said so: the failing run logged zero address-lookup failures. There was no failed lookup to lose to.
So I stopped theorizing and turned on iroh_gossip=debug against the live, broken consoles. The answer was two lines:
NeighborUp(peer)     — the backbone gossip neighbor forms
NeighborDown(peer)   — 30 ms later, inside a conn{peer} span, it's torn down
The neighbor formed and was immediately killed. Cause: I'd seeded the two consoles bidirectionally — each dials the other. That makes two QUIC connections between the same pair, and the connection bookkeeping had a "supersede" step that, on seeing the second connection, called close() on the first — the one iroh-gossip was using as its backbone neighbor. The mesh wasn't broken. My test setup (bidirectional seeding) tripped a latent connection-management bug.
The fix: don't force-close a superseded-but-live connection. Adopt the newest for the data plane and let the stale one idle-time-out. Critically, this can't hurt the common case — a child only ever dials its console (one direction, one connection, nothing to supersede). With it, bidirectional cross-seed shows both meshes again, summaries flowing both ways.
Here is both directions live. Console 1 is mesh1's home and renders mesh2 from the backbone; console 2 is mesh2's home and renders mesh1 from the backbone. The remote mesh's group header is tagged · backbone, and — once the directory started carrying per-node load — every cross-mesh node shows its own CPU and MEM, not a blank box.
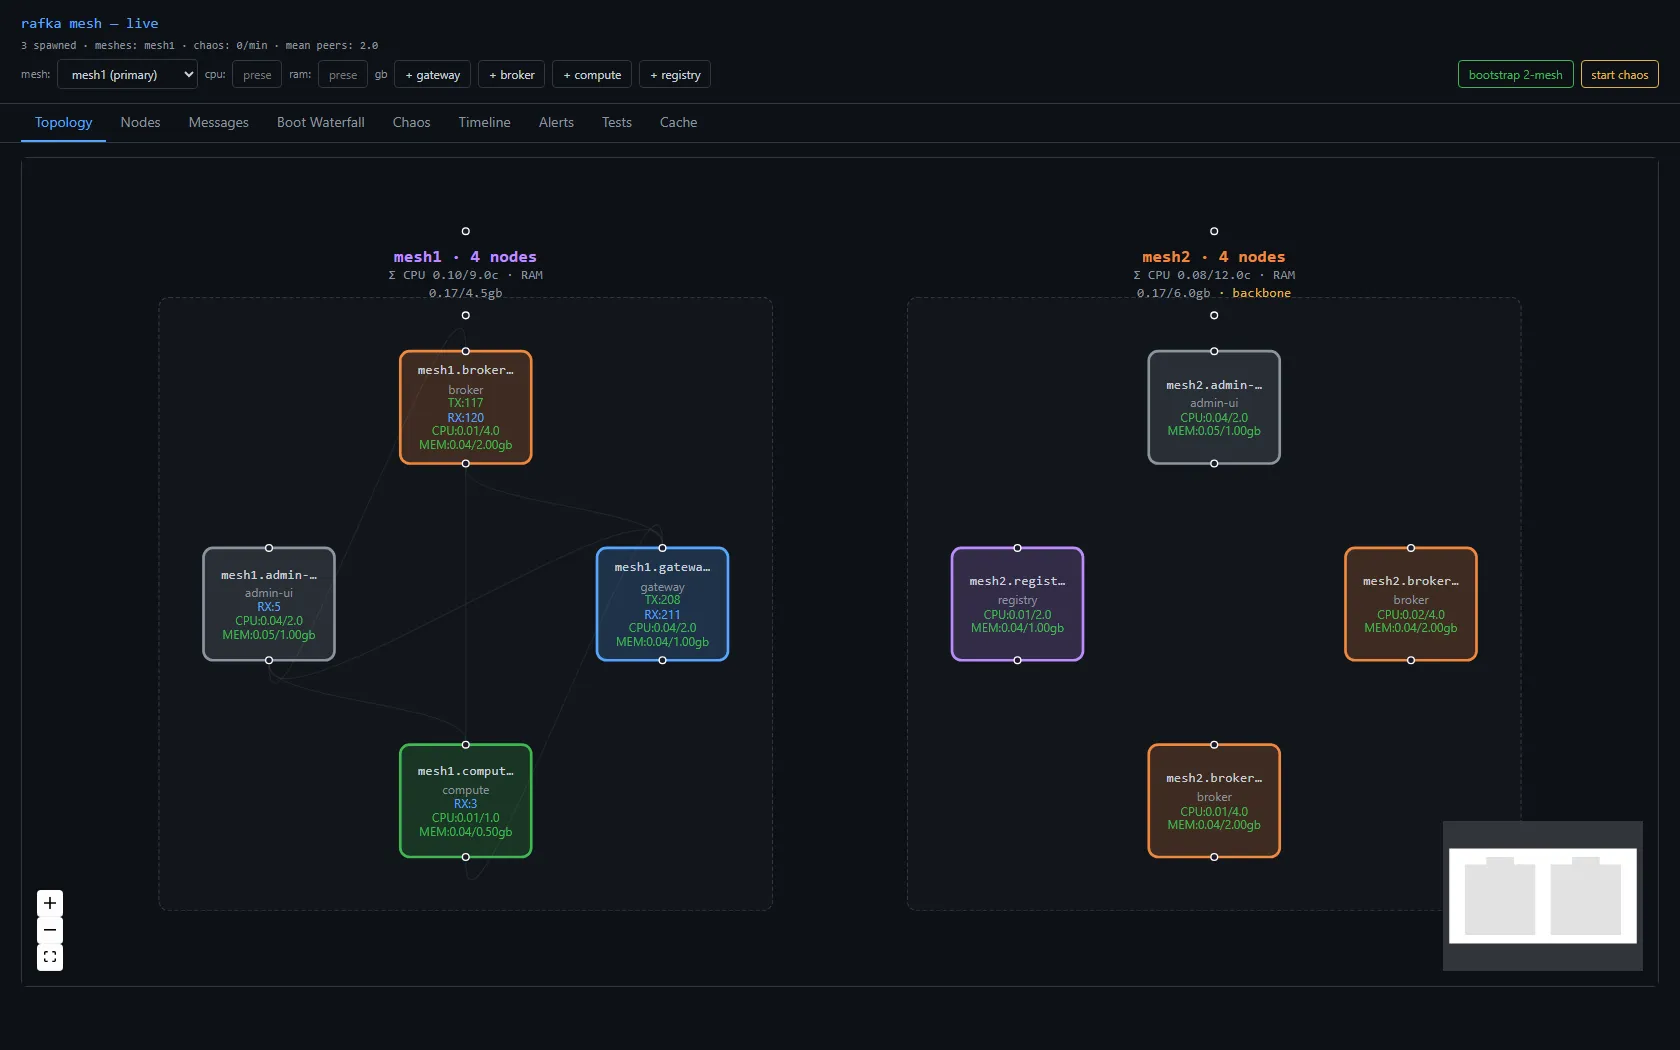
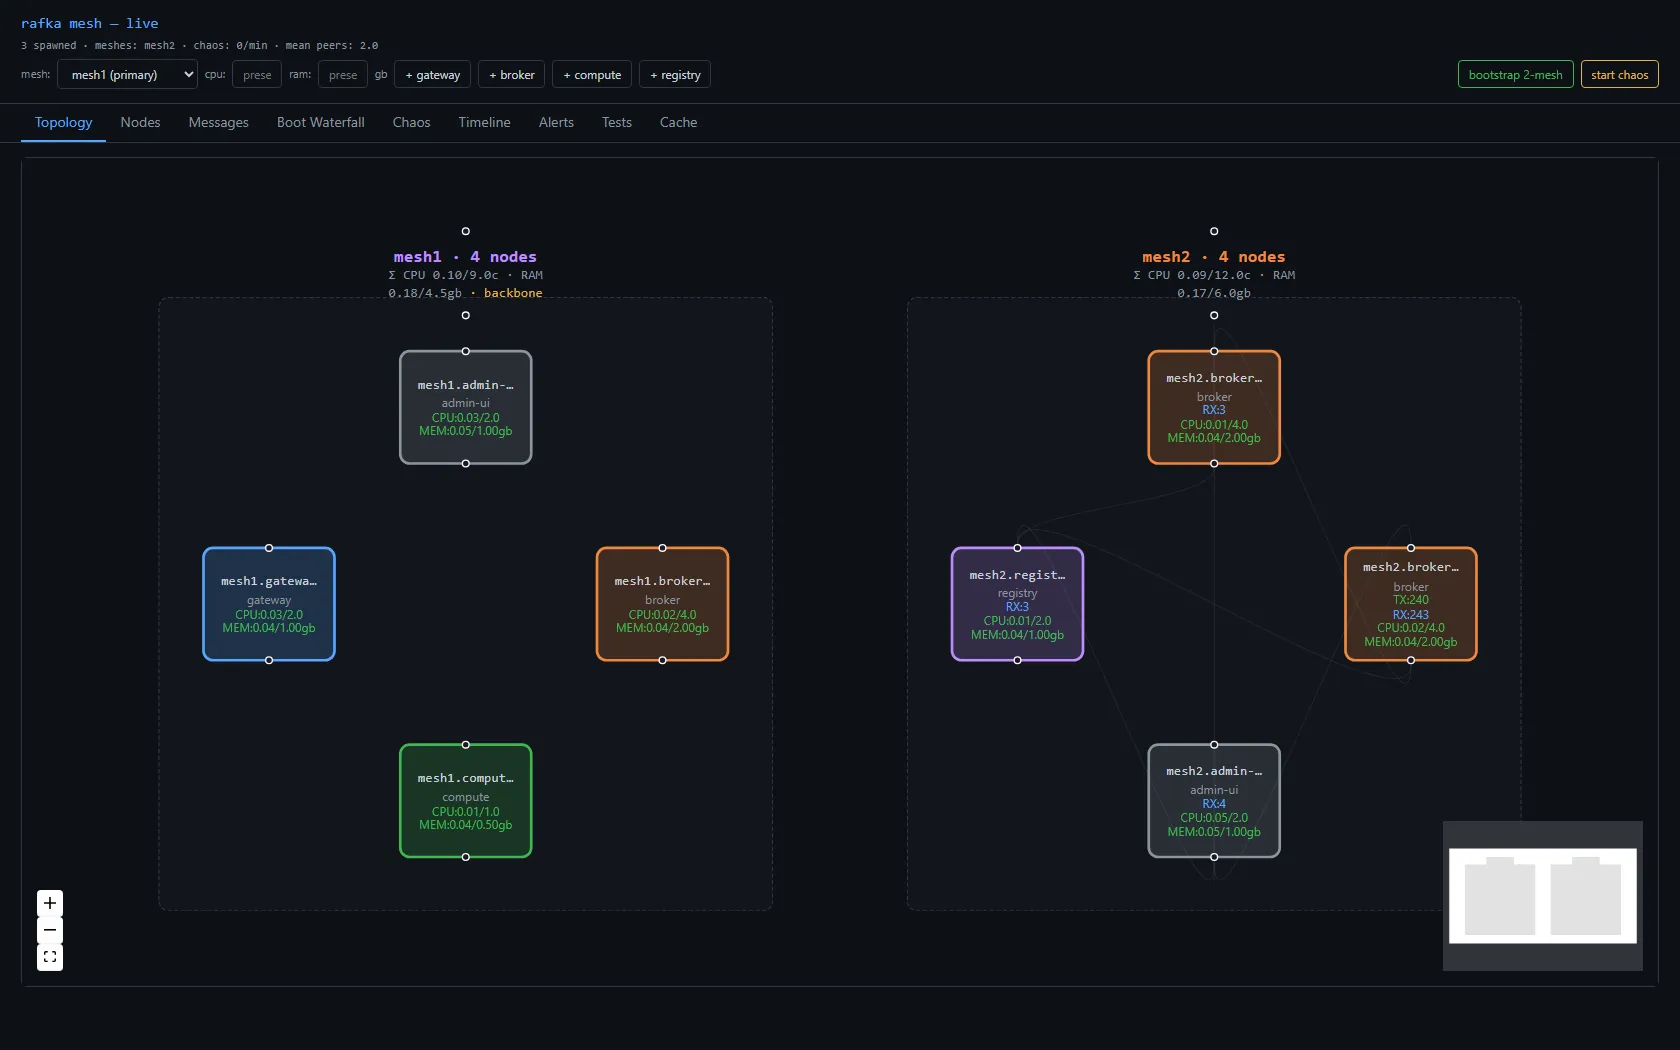
The actual lesson
Both scares were the same mistake waiting to happen: trusting a plausible story over the live signal. The first time, a reviewer caught me reaching for a custom component the library already had. The second time, a refuted-by-my-own-logs root cause nearly shipped — and the cure was 30 seconds of =debug on the running system, not another rebuild. The five relaunch cycles I did burn first taught me nothing; the one debug log taught me everything.
When the mesh "breaks" after a change, the cheapest next move is almost never another change. It's to make the system tell you what it's actually doing — and to write your root cause as a sentence you'd be willing to have your own logs contradict.
What I'd tell a team
- Reach for the library's hook before your own. Both the 40-second join and a dozen smaller things dissolved the moment I used the primitive that already existed. A custom component is a maintenance liability you're choosing; earn it.
- A root cause is a falsifiable sentence. "The lookup races the join" sounded right and my logs had zero lookup failures. If you can't state your root cause as something your own telemetry could contradict, you don't have a root cause — you have a guess.
- Debug the running system, don't re-run it. Relaunching teaches you nothing new; one level of
=debugon the live, broken thing usually teaches you everything. The signal is already there — turn it up before you change anything.
 Part 13 of 16
 Keeping a node's name across a restart
Restart a process in this mesh and, by default, it comes back a stranger — a brand-new ed25519 keypair, a brand-new NodeId, every peer re-establishing to what it thinks is a node it's never seen. Most nodes are cattle and that's fine. This is how I let a few of them be pets: kill the process, respawn it, and have it boot with the exact same identity — and the reaper races I had to defend against to make that true.
Restart a node in this mesh and it forgets who it was. Not its data — its name. A node's identity here is an ed25519 keypair, and the node_id is literally the public key; that's how QUIC routes to it. Kill the process and let it boot clean and load_or_mint_identity does exactly what the second half of its name says: with no key to load, it mints a fresh one. The node comes back, but it comes back a stranger. Every peer that knew the old key has to re-establish to what looks like a node it's never seen, and the old entry lingers as stale until it ages out.
For most of the fleet that's correct. Nodes are cattle — interchangeable, disposable, the topology heals around any one leaving. But a handful aren't: a node pinned to a specific port, holding a specific routing role, the kind you restart to roll a config and want the mesh to barely notice. For those few, a new NodeId on every restart is friction you pay on the whole cluster's behalf. So this is the pets-vs-cattle escape hatch: kill the process, bring it back, same identity.
Where the identity actually lives
The key was never the hard part — admin-ui already had the mechanism. Every child node respects RAFKA_NODE_SECRET_KEY: set it to a hex-encoded 32-byte key and load_or_mint_identity uses it directly instead of minting. Admin-ui already pre-mints each child's key before it spawns the process — that closes a race where two concurrent spawns could otherwise land on duplicate names — so the key is sitting in memory the whole time. Stateful restart just keeps it and re-passes it.
The subtler half is the data dir. On first boot the key gets persisted to node-identity.json under E:/tmp/rafka-ui-nodes/<node_name>/, so there are two roads back to the same identity: the env var on the controlled restart path, and that file on any cold boot. Which means the dir isn't where a node stashes its identity — the dir is the identity. Wipe it and you've killed the node's name even if the process is the one you meant. That reframing is the whole reason this feature is more than a function call — because the mesh has a janitor.
What I had to defend against
Normally a node's exit triggers cleanup. Both kill_one — the operator's DELETE — and a background reaper loop wipe the data dir, node-identity.json and all. That's correct for cattle and catastrophic for a pet. So a stateful node carries three guards, and two of them exist purely because the cleanup is racing the restart.
The dir is never auto-wiped. For a node spawned stateful: true, both the explicit kill and the reaper suppress the directory cleanup. The dir is the identity; you don't get to delete it on the node's behalf. Only an operator wiping it by hand, or a fresh non-stateful spawn claiming the same name, clears it.
The SpawnedMeta record survives the kill. Admin-ui keeps an in-memory record of every child it spawned. For an ordinary node that record dies with the process; for a stateful node it persists across the kill — so the restart route can read back the original secret_key_hex and bind_port, and so it stays visible to the reaper's orphan sweep, the pass that wipes any dir not referenced by a live process or a meta entry. Lose the record and the orphan sweep sees a directory with nothing alive behind it and does its job.
A process-global restarting set. This is the one that bit me. The reaper ticks every five seconds. A restart kills the process, waits for it to actually exit, then respawns — and there's a window in the middle where the process is gone but the dir must survive. If a reaper tick lands inside that window, it sees a dead process and a dir and wipes the identity out from under the respawn. So the node name goes into a process-global DashSet<String> for the duration, and the reaper checks the set before touching anything. One set, two lookups — and without it the feature has a flaky five-second hole that only shows up under exactly the timing you can't reproduce on demand.

Waiting for the process to actually be gone
The restart route is its own function — restart_one — and it deliberately does not call the normal spawn path. That's the load-bearing decision: the normal spawn mints a fresh key, so routing a restart through it would hand the node a new identity, the precise opposite of the point. Instead restart_one reads the SpawnedMeta, rejects with 422 if the node isn't stateful, and rebuilds the command by hand with the same dir, port, mesh, and secret key.
One step in the middle earns its slowness: after start_kill, it waits for genuine OS process exit — up to ten seconds. Not "we sent the signal," but "the kernel has reaped it." That's a Windows reality as much as a correctness one. The node holds a pinned bind_port; until the process is truly gone the OS hasn't released the socket, and a respawn that tries to bind it races the dying process for the port. And on Windows a running executable is file-locked — the same lock that, in an earlier sprint, had me debugging stale binaries for hours because a rebuild silently left the old .exe in place. So you wait for the real exit, then rebind. The ten seconds is a ceiling, not a sleep; almost always the process is gone well under it.
The chaos restart is the opposite on purpose
There's already a restart in this codebase, and it does the reverse of this one. The chaos battery has a restart_node primitive that deliberately mints a new identity — because that's the chaos. The whole point of that test is to prove the mesh heals when a node vanishes and a different node joins in its place: same name to an operator's eye, different cryptographic identity to the mesh.
So the two restarts want strictly opposite outcomes, and they share no code. The chaos path goes through the normal spawn with stateful=false and gets a fresh key by design; stateful restart is restart_one, which never touches that path. Keeping them separate isn't tidiness — it's the only way each can be honest about what it claims. Share a spawn and one of them is lying about identity.
One field on the wire
A node now advertises whether it's stateful. Each one appends stateful: bool to its GossipDigest — the payload it broadcasts to every mesh member every two seconds — and admin-ui's topology and heartbeats endpoints surface it so the UI can badge the pets.
The interesting part is where the field goes, and it's a postcard constraint. Gossip is serialized with postcard, which is positional — no field names on the wire, just order. So a new field has to be appended, never inserted, and it carries #[serde(default)]. An old node decoding a new digest runs off the end of the bytes it understands and fills stateful from the default: false. A new node decoding an old digest does the same. The cluster stays mixed-version-safe through a rolling upgrade because the default is the truthful answer for any node that doesn't know the concept yet. Append-with-default is the entire compatibility story — one line of attention at the end of the struct.

What I'd tell a team
- Find the thing that is the identity and refuse to delete it automatically. Here it's a directory holding a key file. The cleanup that's correct for a disposable node is destruction for a durable one. Make the cleanup ask "am I allowed to wipe this?" not "is the process gone?"
- A self-healing mesh has a janitor, and the janitor races you. The reaper that wipes orphaned dirs is exactly right — until a restart creates a window where a live node's dir momentarily looks orphaned. Any background reclaimer on a timer will eventually tick inside your critical section. Carry an explicit "hands off" marker through it; don't hope the timing misses.
- Wait for the real exit, not the signal. "We called kill" and "the OS has released the port and the file lock" are different facts, and on Windows the gap between them is where a rebind fails or a stale binary survives. Gate the respawn on genuine process death, with a ceiling, not a guess.
- When two operations want opposite outcomes, give them no shared code. One restart preserves identity, one destroys it on purpose. Routing both through one spawn forces a flag-soup that lies to half its callers.
What's next
A pet node now keeps its name across a restart, which is the first thing you need before a node can keep anything else across one. The obvious next thing it should keep is its data — a local cache it can answer from directly instead of going back to the mesh for every read. Stable identity is the floor under that: a cache is only worth warming if the node it belongs to is still the same node when it comes back up.
 Part 14 of 16
 Extending the mesh with node caches
Membership gossip lets every node know the mesh — but knowing it isn't using it. To route, a node needs a stable view it owns: a cache. This is the post where one cache quietly becomes many, every tidy first answer turns out wrong, and the live system tells me the shape each time.
By now the mesh gossips membership cleanly: every node sees every other node's digest land in live_digests() — id, type, address, load, state. That's enough to know the mesh. It is not enough to use it. To route — pick a live broker, dial a gateway, hold partition ownership across a network blip — a node needs a stable, queryable view it owns. That view is a cache. This is the layer that turns a membership substrate into something a product can stand on.
Why a cache, and why not an API
The tempting wrong answer is to make node-admin the oracle: a node that wants the topology asks it over HTTP. That's a poll, a central dependency on the hot path, and a cold-start gap where a freshly-booted node knows nothing until its first request returns. A node should not ask who its peers are. It should already know.
So the cache is a local projection of gossip the node already receives. The mesh carries membership whether you build a cache or not; the topology cache is just that stream, materialized and queryable, on every node. node-admin's /api/topology endpoint still exists — but it's for a human looking at a console, never for a node looking up a peer. Nodes never poll. The directory that the cross-mesh backbone publishes is the same instinct one layer out: awareness lives in the gossip, not behind a request.
Born knowing
A projection of gossip is current within a second or two of boot — but "a second or two" is a window where a node can't route. So node-admin, which is the thing that spawns nodes, hands each child the current topology at birth: it snapshots its own view and writes it where the child reads it before gossip even starts. The node comes up already holding the mesh.
I proved it with a staggered spawn — one node every ~18 seconds, each born into a mesh one larger than the last:
gateway  (1st spawn)  ->  born with injected = 1   (admin only)
broker   (2nd spawn)  ->  born with injected = 2
compute  (3rd spawn)  ->  born with injected = 3
gateway  (4th spawn)  ->  born with injected = 4
broker   (5th spawn)  ->  born with injected = 5
Each node was born knowing exactly the mesh that existed at its moment of birth — not an empty cache it had to fill, not a poll it had to wait on. Gossip takes over from there. The mother hands the child what she knows; the child grows up on the mesh.
A cache has to forget
The first version only ever added. That looks fine until the mesh churns. I ran a 30-minute chaos soak — node-admin killing and respawning a random node every 30 seconds, 110 kill/respawn events — and watched the caches climb: 4 nodes, then 7, then 11, ghosts of every dead node never cleared. Worse, the nodes disagreed — each had accumulated a different set of corpses depending on what it happened to witness. A topology cache where no two nodes agree is not a topology cache.
The fix is one line of intent: each tick, reconcile against live_digests() and drop whatever's no longer there. And the elegant part — live_digests() already ages out a node that's gone quiet on the mesh's ~30-second keep-alive. So the cache doesn't need its own timer or tombstone clock; it inherits the mesh's. Re-soak, same 30 minutes of carnage: held at 4 the whole way, 59 distinct node ids cycled through, every node converged. A cache that only learns is a leak. It has to forget on the same clock the mesh forgets — which is the same chaos-soak discipline that's caught everything else in this series: run it long enough that a slow leak has to show itself, then watch the number.
One cache becomes many
Topology is the first cache, not the only one. Compute needs virtual-topic assignments; a gateway needs routing and ACL state; different roles remember different things. So: many caches, on many nodes.
The first model I reached for was a channel per node type — "the gateway channel," carrying everything a gateway gossips. It's clean right up until a cache is shared. Virtual-topic assignments are needed by compute and gateway. On node-type channels, that one cache has to be published on both channels — duplicate traffic, and now every receiver has to dedup. And a gateway that joins the compute channel just to hear virtual-topic assignments also eats all of compute's private chatter it doesn't care about.
The inversion fixes it: channel by the data, not by the node. One gossip topic per cache type. A node subscribes to exactly the caches it needs. A shared cache is simply a topic with more than one subscriber — no duplication, no dedup, no cache that has to know the list of node types that consume it. The channel belongs to the cache; the node picks the caches.

Two axes, and why each cache picks a spot
With caches as first-class things, each one declares two properties — and the two distinctions are the whole design.
Channel — Main or Dedicated. Most caches get their own topic. But topology rides main: membership gossip is mandatory for the mesh to function at all, so every node already holds that data for free — giving topology its own channel would re-ship what everyone already has. "Rides main" is a property, not a topology-shaped hack; any future cache that's a pure projection of membership can pick it too.
Write model — who may publish, and how conflicts resolve. Three kinds:
- Leader-only. Only the elected node-admin writes; it assigns the order. Trivial to reason about.
- Self-key. Each node writes only its own row. Membership is this — my digest is my key. Two nodes can never fight over a key, because the key is the writer. No conflict resolution, ever.
- Shared-key. Anyone writes any key. This is the only model that needs real conflict resolution — and a wall clock will not do it, because clocks skew. It needs a monotonic
epochand last-writer-by-epoch. Virtual-topic assignments are this.

The trap is treating every write the same. Most caches are not shared-key; bolting epoch + resolve onto a self-key cache is machinery you'll never use, and omitting it from a shared-key cache is silent divergence that passes every test until the day two nodes write the same key a millisecond apart. The model's job is to make you say which one each cache is — so only the caches that actually contend pay for contention.
Seeing it
The console grew two tabs, because a design you can't watch is a design you're guessing at.
The Caches tab is a matrix — cache types down the side, node types across the top, the count in each cell where a node type holds that cache. Each cache wears its write model as a badge: a green Key on the self-key rows, an amber Leader on the leader-only ones, a blue Shared on the shared caches, and a KeyGossip + main pair on topology-key-gossip, the one that rides main. The shared rows light up several columns at once — that's a shared cache made visible — and the topology row reads 5 across every node type, because everyone holds membership. admin-ui holds them all: it's the authority and the observer.
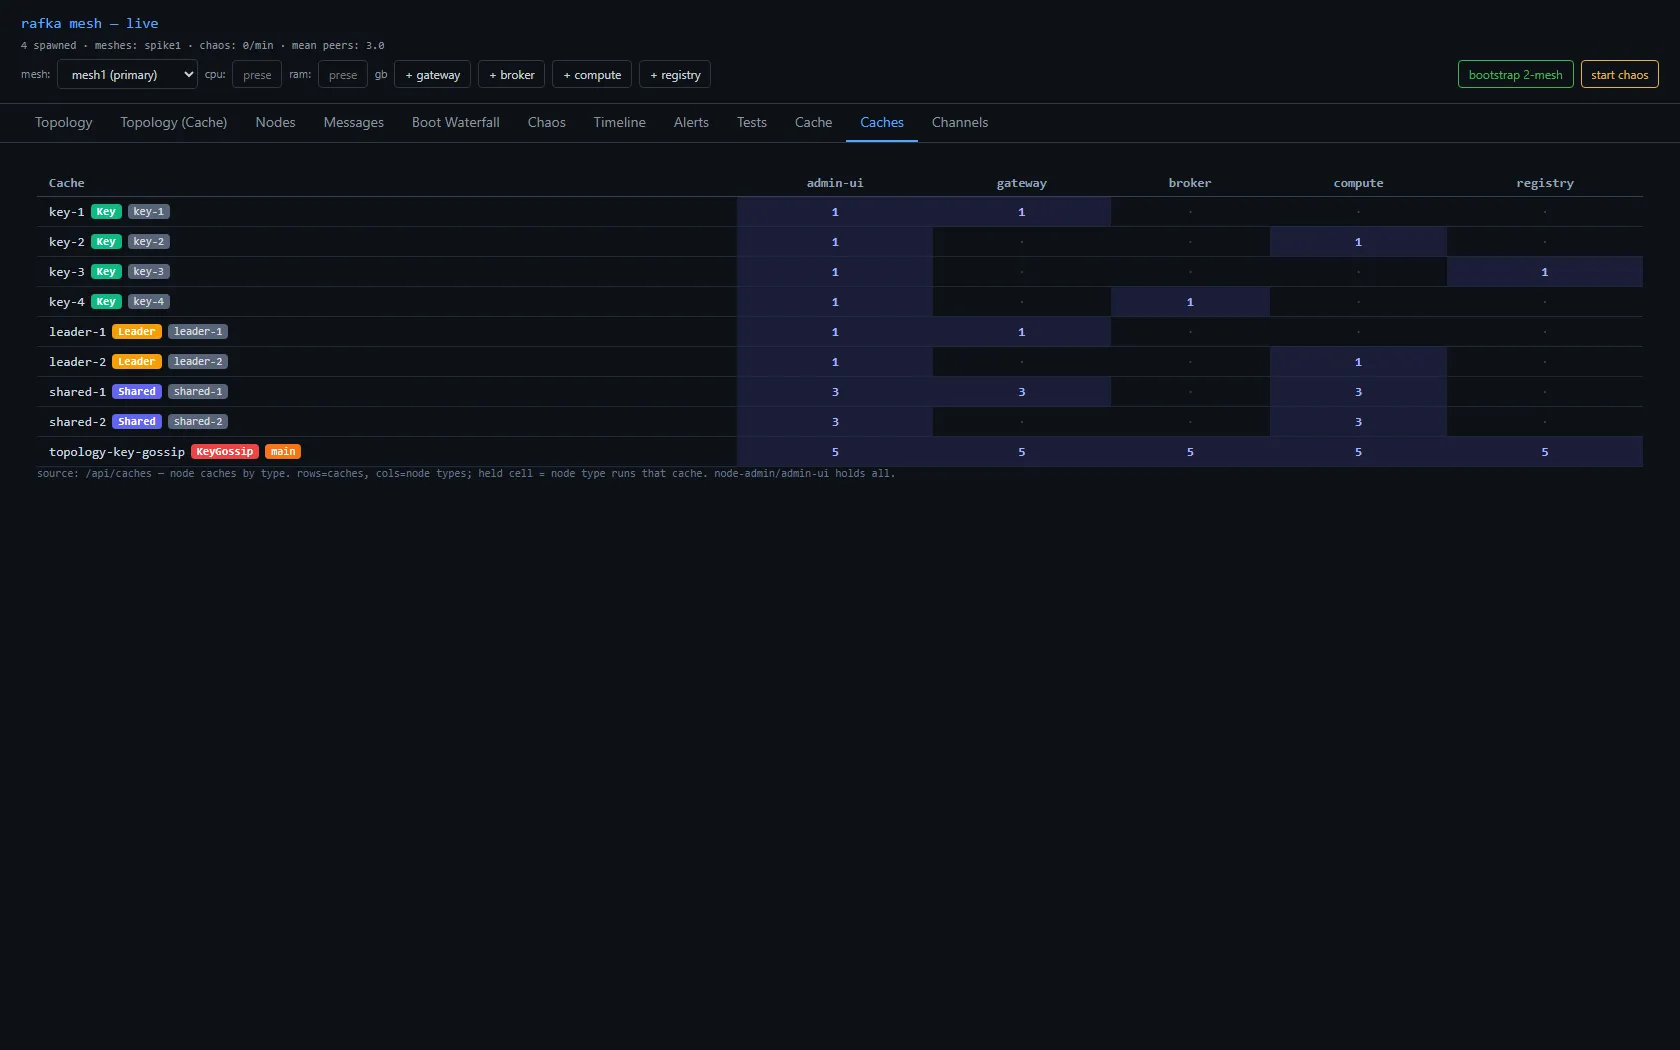
The Channels tab is one live gossip stream per topic — a main REAL column for the real mesh traffic, plus a column per cache channel. Each event line stamps the publisher's hash, whether it was a publish or a receive, and a climbing sequence number. The publisher on each line makes the write model visible: a leader-only channel only ever shows one writer publishing; a self-key channel shows each node only writing its own; the others just receive. The taxonomy isn't a comment in the code — it's a thing you watch scroll by.
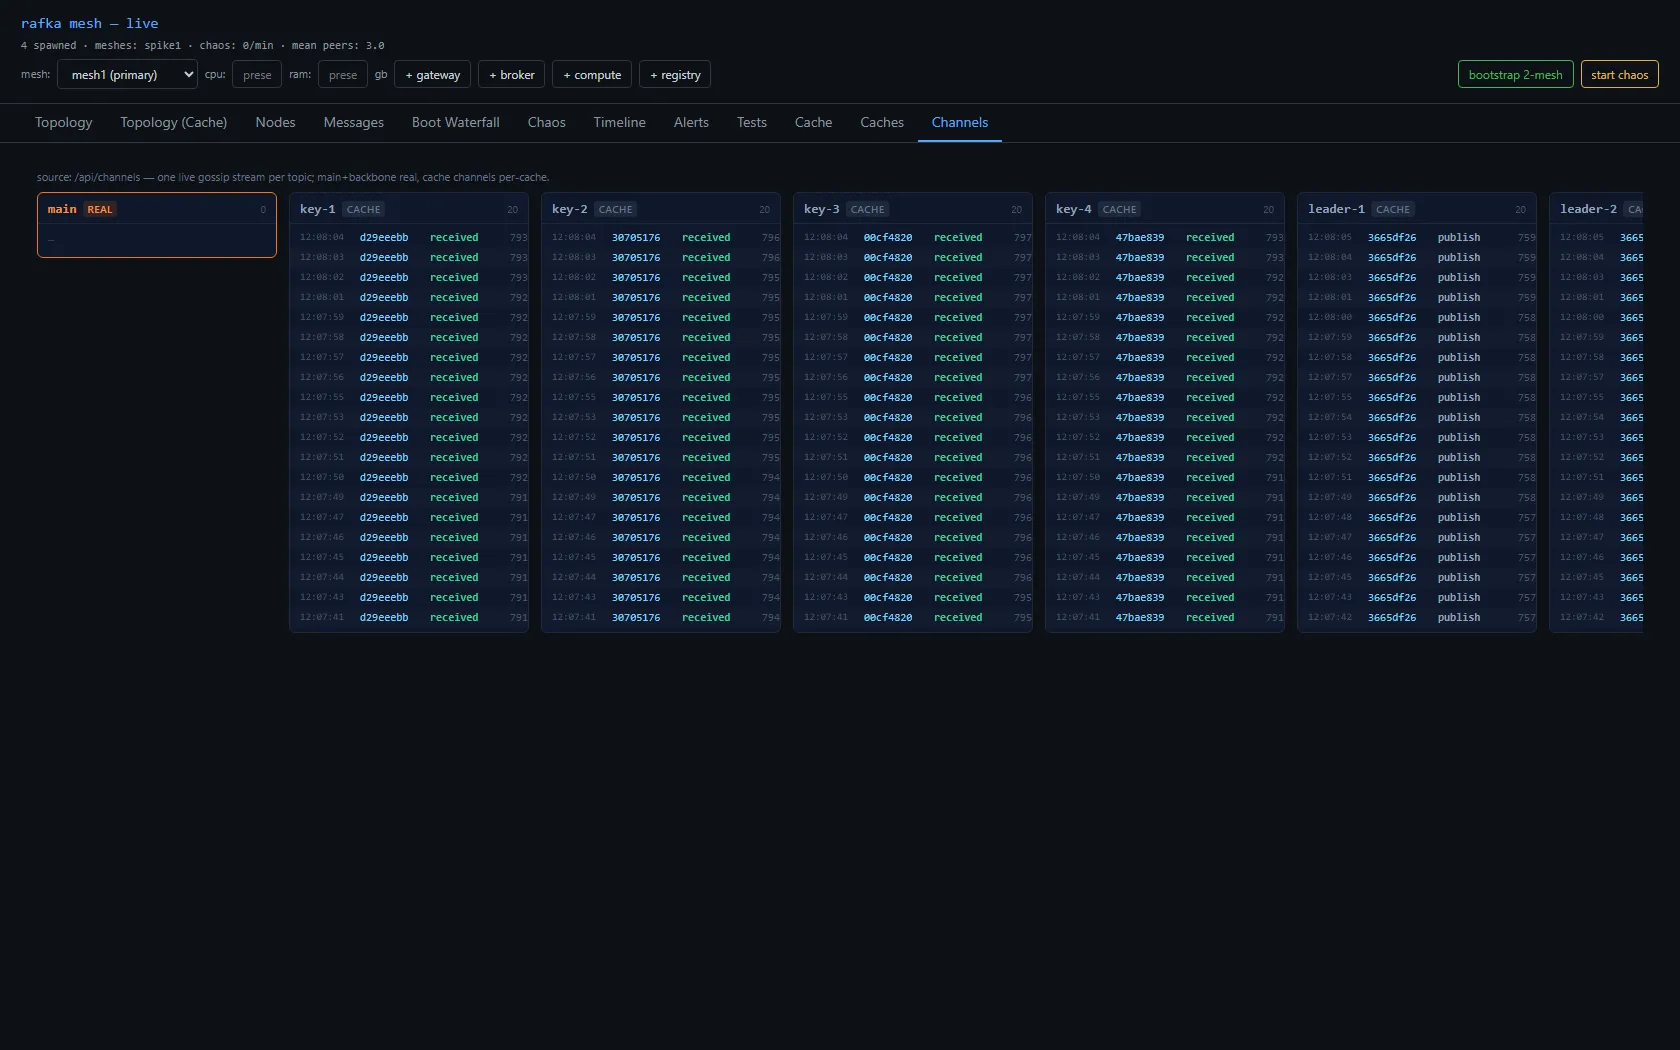
What I'd tell a team
- A node shouldn't ask who its peers are. If you find yourself building an oracle that nodes poll on the hot path, stop — the membership stream is already arriving at every node. Materialize it locally and the central dependency, the poll, and the cold-start gap all disappear at once. Build the API for the human at the console, not for the node looking up a peer.
- A cache that only learns is a leak. Adding is the easy half; the half that matters is forgetting, and forgetting on a clock you didn't invent. Reconcile against the live membership view and let it inherit the mesh's keep-alive. A separate tombstone timer is a second clock to get wrong.
- Channel by the data, not by the node. The instinct is to name a channel after a role. Name it after the cache, and a shared cache becomes "a topic with more than one subscriber" instead of "a payload duplicated across two channels that everyone has to dedup."
- Make every cache declare its write model. Self-key needs no conflict resolution and shared-key needs a monotonic
epoch— never a wall clock. The danger isn't picking wrong; it's never being made to pick, so a shared-key cache ships with no resolution and diverges silently the first time two writers race.
The pattern, one layer up
The mesh was the easy part — it already knew who was alive. The hard part was the shape of what each node remembers: born knowing instead of polling, forgetting on the mesh's own clock, channeled by data instead of by node, and honest about who's allowed to write. Every one of those started with a tidy first answer — ask the oracle; only add; one channel per node; a write is a write — and every tidy answer was wrong. What corrected each one was the same thing that corrected the bug that wasn't in the mesh: the live system's own signal. A 30-minute soak that wouldn't stop growing. A staggered spawn that printed the ramp. A shared cache that simply would not fit a node-type channel. Build the layer that lets the system tell you the shape is wrong — then believe it.
What's next
Every node now holds the caches it needs and forgets the ghosts it doesn't. But nothing yet decides who is even allowed in the gossip in the first place — any process that can reach the topic can join, read every digest, and write its own. The next post draws that line: a trust boundary at the edge of the mesh, deciding admission before a node ever lands in anyone's live_digests().
 Part 15 of 16
 A certificate that rides the gossip — and why I moved it
iroh proves who a node is for free, but it has no opinion on whether that node belongs here. I built the trust boundary two ways — riding the membership gossip, then checked at the connection — and only one survives a real design; here's the wrong turn, the answer, and why it isn't HMAC and isn't quite mTLS.
Everything up to here assumed one thing the mesh never actually enforced: that a node showing up in the gossip belongs there. Awareness and delivery across meshes were built and proven; every node even got its own local cache it owns. But the membership rule the whole time was embarrassing — anything that could speak the wire and join the topic became a member. Fine for a demo. Not a trust boundary.
This post adds one. The shape turned out small; the interesting part is a wrong turn I took first — a version that worked, was arguably more elegant, and still wasn't the right place to put the check.
Identity is not authorization
Start with what's already free. A node's NodeId is its ed25519 public key, and every QUIC connection iroh opens cryptographically proves the peer holds the matching secret. There's no spoofing a NodeId — the transport settled that before I wrote a line. I'm not re-proving identity here. Identity is done.
What iroh deliberately does not answer is policy. Is this authenticated node allowed on this mesh? What role does it have — gateway, broker, admin? Until when? Those are application questions, and iroh is a networking library that correctly refuses to have an opinion about my membership model. So the gap to fill is authorization, not authentication — and holding that distinction is the whole reason the answer lands where it does.

The shape: node-admin is the CA
The node-admin already creates every node — it spawns them with their topology — so it's the natural certificate authority. It holds one ed25519 keypair, reusing iroh's own crypto with no new stack, and that key is the root. When it spawns a node, it signs a tiny certificate over the node's identity:
pub struct NodeCert { pub node_id: String, pub node_type: String, pub expiry_ms: u64 }
// signed by the admin's CA key over postcard(cert) -> SignedCert { cert, sig }
The cert is nothing more than a signed assertion: the CA says NodeId X has role R until T. The only real question — the one this whole post is about — is where you verify it. There were two candidates, and I built the wrong one first.
The wrong turn: verify it in the gossip
I built this one first because it had a property I wanted. The node carries the cert in its gossip digest — the heartbeat it already broadcasts — and every receiver verifies it before admitting the node to live_digests(). No valid cert, the digest gets dropped, the node never enters anyone's topology. Three checks on receipt:
- the CA signature is valid against the admin's public key,
- the cert's
node_idmatches the iroh-authenticated sender's NodeId — the anti–cert-stuffing bolt, so you can present your own cert but not wear someone else's, - it isn't expired.
And it works. I spawned six processes; only five entered the graph.
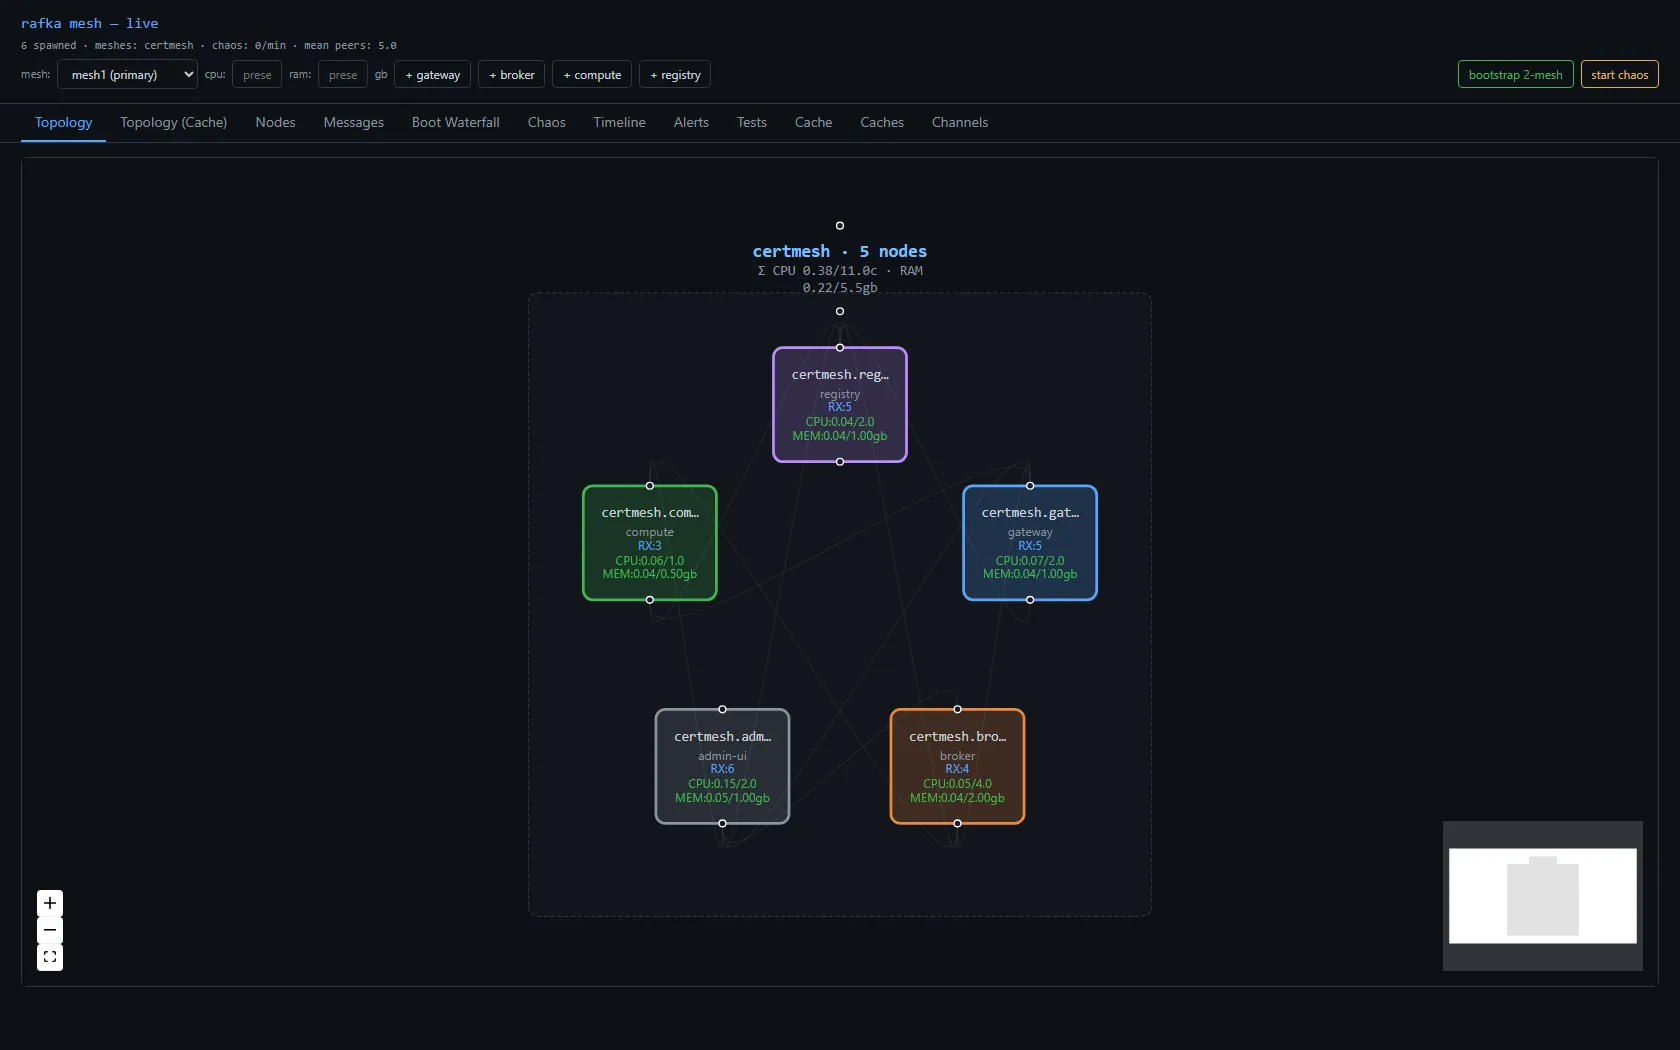
The console says it in one line: 6 spawned · 5 nodes. The sixth process launched with no cert, the boundary never let it into the graph, and the drop isn't a silent nothing — it emits a rafka.cert.reject span on every peer, queryable in Jaeger. It even bought something genuinely cool: it was the one thing that let a cross-mesh repeater carry trust. The repeater relays digests, so a signed cert riding the digest re-broadcasts into another mesh and validates end-to-end against a shared root. Trust that propagates by gossip and survives a relay hop — I liked it a lot.
So why is it a wrong turn?
...and the answer: verify it at the connection
Riding the gossip had exactly one load-bearing reason — that repeater. And the repeater is an experiment, not a destination. Cross-mesh in any real deployment isn't a digest-relaying middlebox; it's two nodes that open a direct connection to do work. Take the repeater away and the gossip-cert has no job left: the only thing it still buys is "an uncertified node is invisible in the topology" — marginal defense-in-depth, and I was paying for it by parsing security-critical content inside the gossip path, the one place in the whole system I most want to stay dumb and fast.
So the cert belongs at the connection, not in the gossip. A node presents its SVID — the short-lived signed credential — as the first bi-stream frame when it opens a connection to do work, and the far side runs those same three checks right there, before it trusts the connection for any data. Gossip goes back to being pure soft-state membership, carrying no trust at all. One gate, at the door, on the connection you're actually about to use.

That's the lesson this series keeps re-teaching me. I made the relay prove it carries instead of trusting that the path existed; I chased a bug that wasn't where the theory said it was. Same shape every time: the tidy, clever mechanism — trust that rides the gossip and survives a relay — lost to the boring one that checks the credential where it gets spent.
Why it isn't HMAC
A shared-secret HMAC was the earlier direction in the project, and retiring it for signing is half the reason this post exists. HMAC is symmetric: the key that verifies a MAC is the same key that mints one. Once you see that, you can't unsee it.
Symmetric means there's no issuer/verifier split. I wanted a CA that issues and a fleet that only verifies — but with HMAC every verifier is also a forger, because anyone who can check a cert can fabricate one for any identity. The blast radius is the whole mesh: recover the shared secret from one node and you can forge every node. And the shared root — the thing I was about to lean cross-mesh trust on — becomes a shared forging key. That's not a root of trust. That's a skeleton key handed to everyone.

Asymmetric signing fixes all three for the cost of switching one primitive. The CA's secret issues, its public key verifies, and a verifier can prove a cert genuine without ever being able to produce one. The whole reason a root of trust works is that the thing you hand out can't be used to forge.
Why it isn't quite mTLS
The honest version: presenting the SVID at connect-time is the mTLS idea — a credential exchanged and verified when the connection opens. I just didn't reach for X.509 mTLS to do it, and the reason is the one I keep coming back to: identity is already free.
iroh's QUIC is already mutually authenticated, by the NodeId — an ed25519 key both ends prove. Bolting X.509 on top would re-prove the identity I have for nothing and drag in a whole PKI: cert chains, ASN.1 parsing, CRL or OCSP for revocation. The only thing I need to add is the authorization layer — {NodeId, role, expiry}, CA-signed — and a short-lived ed25519 SVID as the first bi-stream frame does exactly that, on iroh's existing crypto, with revocation as a short TTL plus re-issue instead of a revocation list. mTLS-shaped, built the cheap way: identity from iroh, authorization from one tiny signed frame on top.
The shared root still earns its keep
The repeater was the part to drop. The shared root that rode on it was the genuinely good idea, and it survives the move intact. The CA key is one keypair, and it's shareable: copy ca-secret.json into a second admin's data dir before it boots, and now two meshes issue certs from the same root.
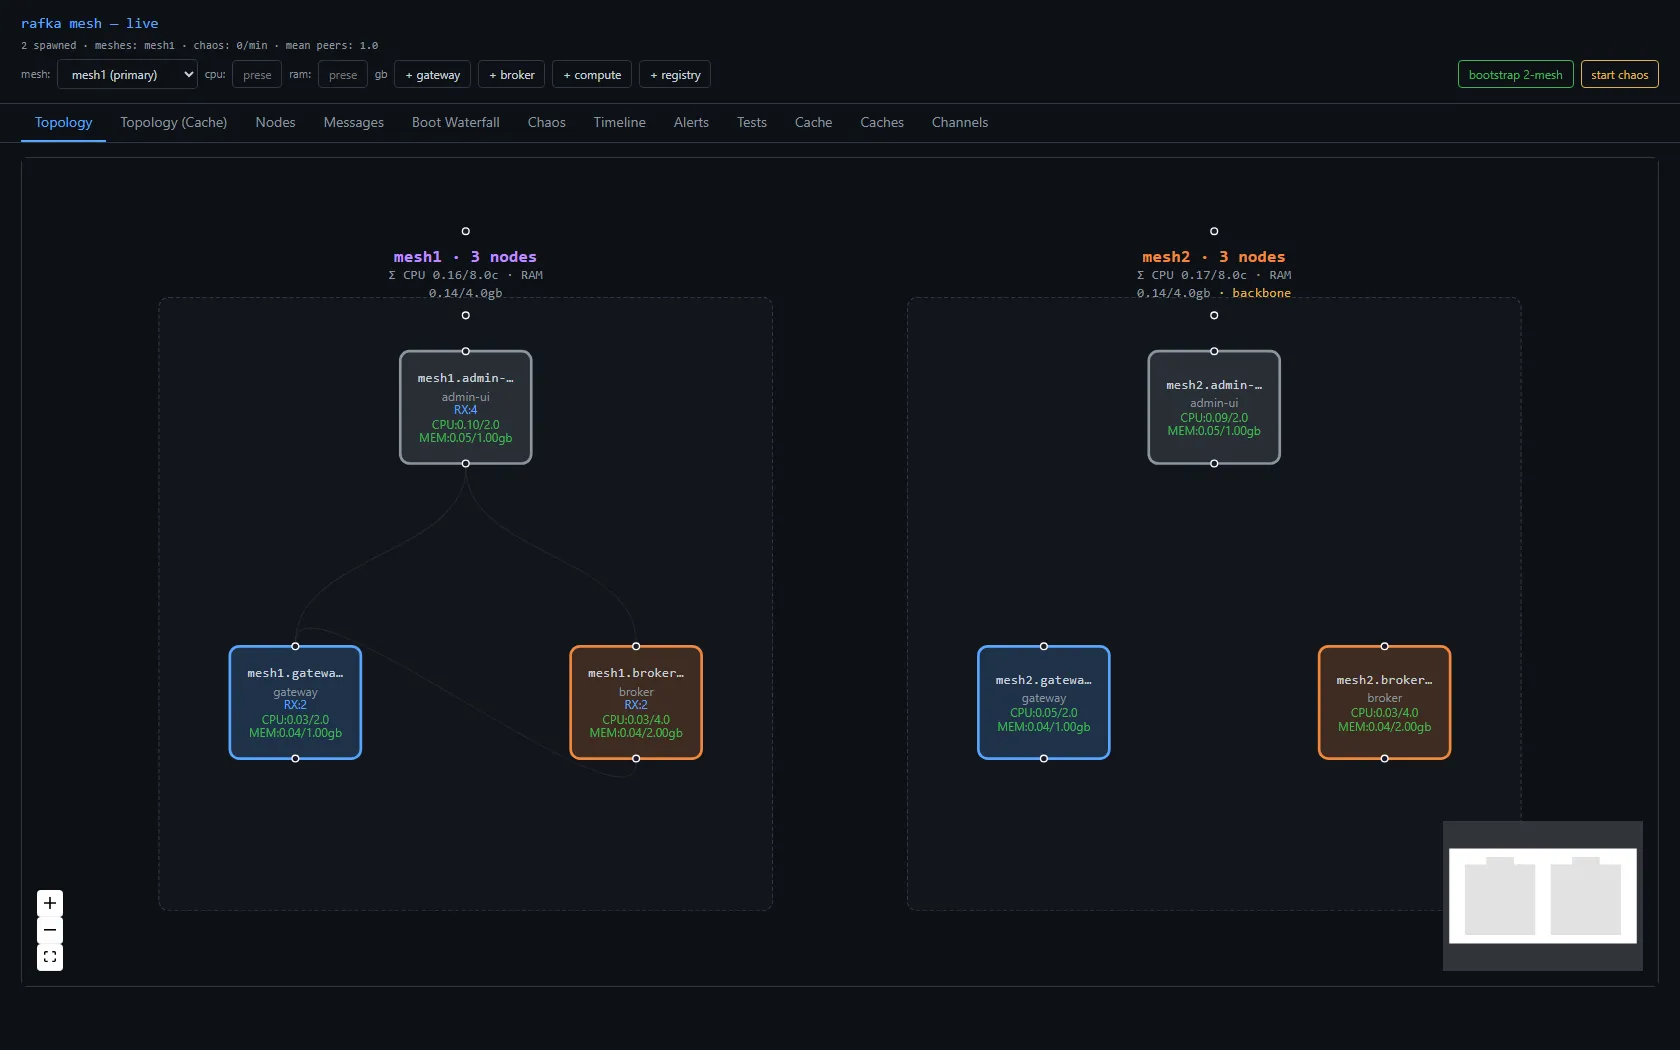
That's what makes cross-mesh trust work without the repeater. When a mesh1 node opens a direct connection to a mesh2 node, it presents its SVID and the far side verifies it against the shared root. The two certs trace back to one authority, so the connection is trusted — even though the meshes never share a single gossip message. The trust travels with the node, on the connection, not through the membership layer.
What it cost
One ~100-line cert.rs — issue_cert and verify_cert, hex-postcard on the wire — plus exactly one verification point, the bi-stream a node already opens to do work. No PKI. No new crypto dependency. No extra round-trips, because the credential rides a frame that was going to be sent anyway. The gossip experiment wasn't wasted: it was real, it was verified, it shipped its rafka.cert.reject spans, and it taught the lesson by being the more elegant answer that turned out to be the wrong one.
What I'd tell a team
- Separate the two questions before you build anything. Who is this and is it allowed here feel like one question and they are not. iroh answered the first for free; the second is yours, and the whole design clarifies the moment you stop trying to make one mechanism carry both.
- Check the credential where the trust is spent, not where it's convenient. The gossip-cert was convenient — the heartbeat was already flowing — and it went green every time. But "it works" is a claim about the mechanism, not about whether the mechanism belongs there. The trust gets spent on the connection that moves data, so that's where the check belongs. A clever check in the wrong place is still in the wrong place.
- Pick asymmetric the moment issuer and verifier should be different roles. If every party that checks a credential can also forge one, you don't have a root of trust, you have a shared secret wearing a costume.
Identity was iroh's job. Authorization turned out to be one signed cert — checked at the door, where the trust is actually spent.
What's next
The substrate has a trust boundary now, and a clean answer to who belongs here. That's a lot of pieces stacked up over a lot of sprints — awareness, delivery, lifecycle, caches, and now a credential at the door. At some point the honest move isn't to add another piece. It's to step back and ask whether the whole thing is actually ready to build on, or whether I've been admiring the scaffolding. That's next.
 Part 16 of 16
 Is it ready? We iroh'ed out the basics
Sixteen posts in, the question stops being rhetorical: is this thing actually ready to build a real product on? Short answer — yes. We have, and I will not apologize for the pun, iroh'ed out the basics. Here's the verification that earns the 'yes,' the short list of things I'm cheerfully not pretending to have solved, and a thank-you to n0 that I mean every word of.
When this series started it was a hunch wearing a hostile question: can a self-organizing P2P mesh in Rust actually hold up under load, or am I about to spend a year proving it can't? Somewhere between an 80-core box pegged at 100% by eighteen idle nodes and a chaos battery that refused to stop finding leaks, the question quietly stopped being rhetorical. So let me answer the one in the title.
Is it ready to start the real project on? Yeah. It is. We have — and I'm genuinely not sorry — iroh'ed out the basics.
That's the verdict, up top, because I'm not going to make you scroll to the bottom for a shrug. But "it's ready" is a claim, and claims that ride on a wall of green screenshots have a well-documented habit of being lies. So before I take a victory lap, let me show the work that earns the lap.
First, the caveat I refuse to bury under the confetti
Every gorgeous number in this series — RSS flat, CPU at 0.02 cores, zero panics across a four-day soak — was measured against nodes that do almost nothing. They receive a frame, emit a span, ack in microseconds, and go back to their hammock. Those numbers are floors for an empty substrate, not promises for a busy one. The day a node writes a durable record and holds a real backlog, the latency curve and the memory profile are going to develop opinions they don't have today.
I lead with this because it's the single assumption most likely to mug the version of me that builds on top of this next month. The foundation is solid. The foundation is also unloaded. Both are true at once, and only someone trying to sell you something tells you just the first one.
What actually earned the "yes"
Not vibes. I wrote down every claim the substrate makes, sorted them into proven, deferred, and not my problem yet, and then went and ran the provable ones until they either held or embarrassed me in front of Jaeger.
Produce/ack holds under concurrency. I scaled to ten gateways producing at once — each writing to a node in its own mesh and one across the backbone — against five brokers per mesh, and held it for two and a half minutes. 600 produce.handle in 150s (~4/s fleet-wide, dead steady) and 640 produce.ack — the full produce → handle → ack round-trip completing, not fire-and-forget optimism. Zero frame.decode_failed, zero panics, zero QUIC assertions; 20 processes the whole way, RSS flat (+1.2%, which is noise wearing a trench coat).
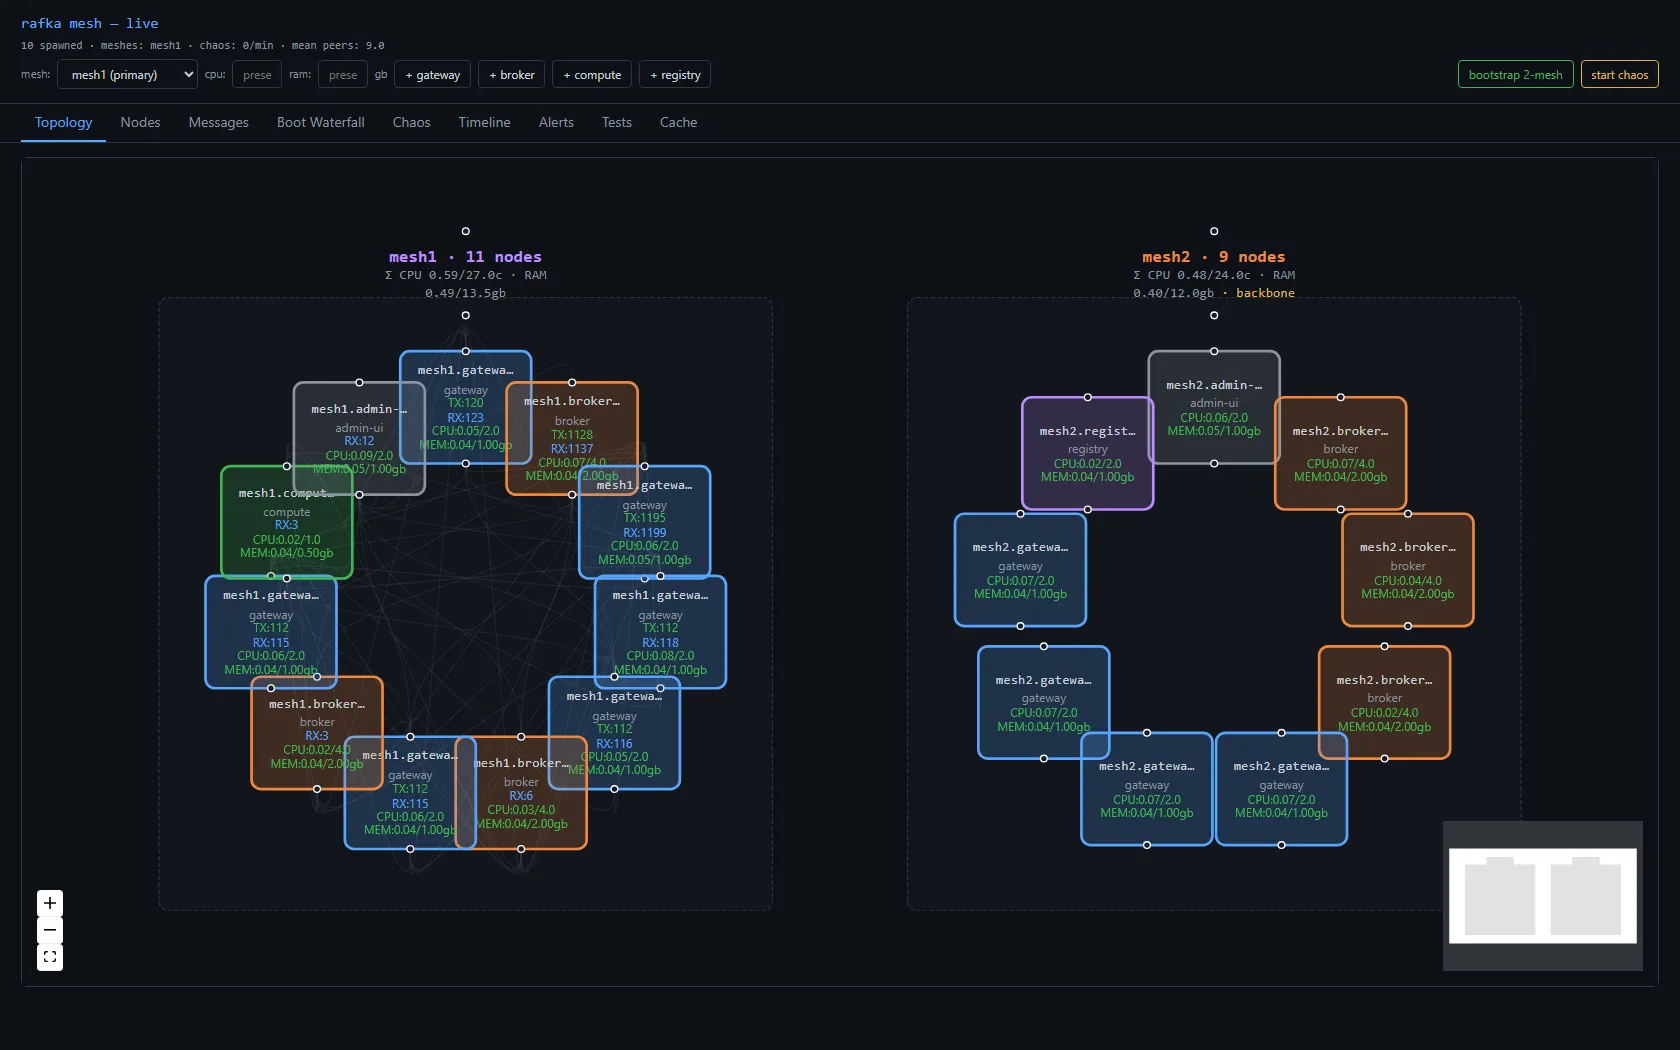
It degrades like an adult and recovers without being asked. I killed both cross-mesh write targets and watched. The gateway didn't crash and didn't spin — RSS flat, CPU ~0.09 cores, no retry storm, no sulking — and the intra-mesh write kept flowing the entire time. Cross-mesh produce.handle fell to 0 during the outage while intra held at 7. Then I brought one broker back, and the cross-mesh write resumed on its own the moment the backbone reconverged. Nobody pushed a button.
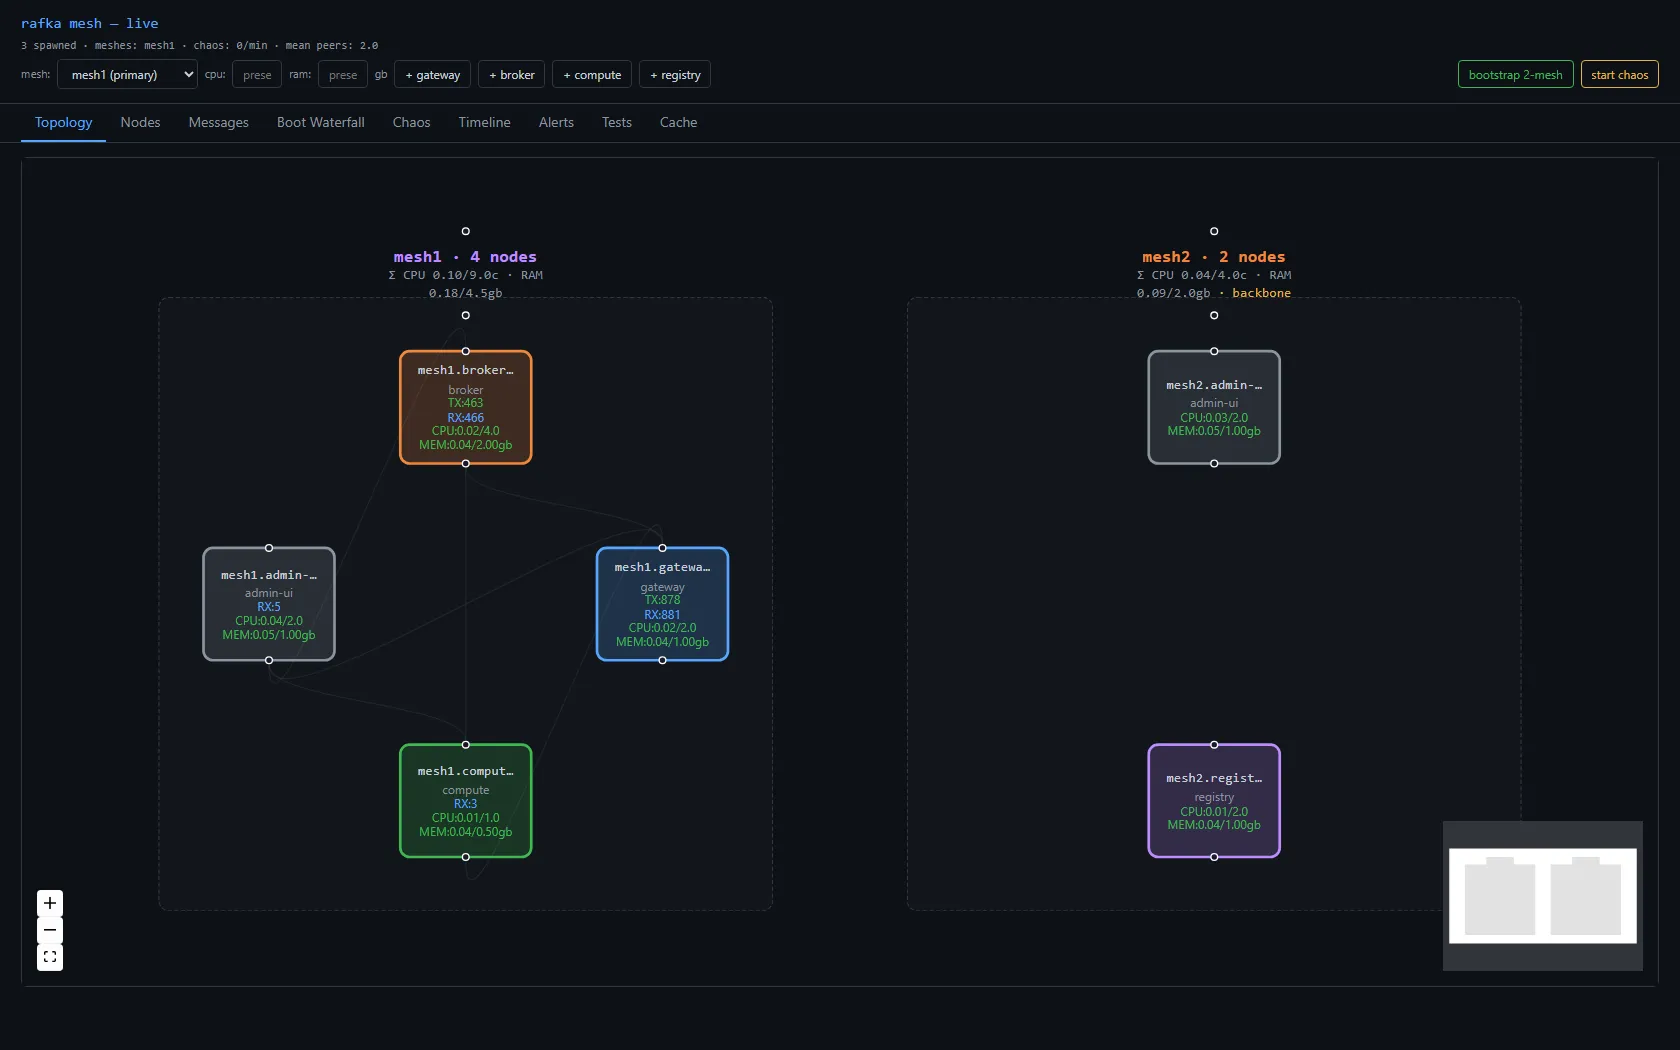
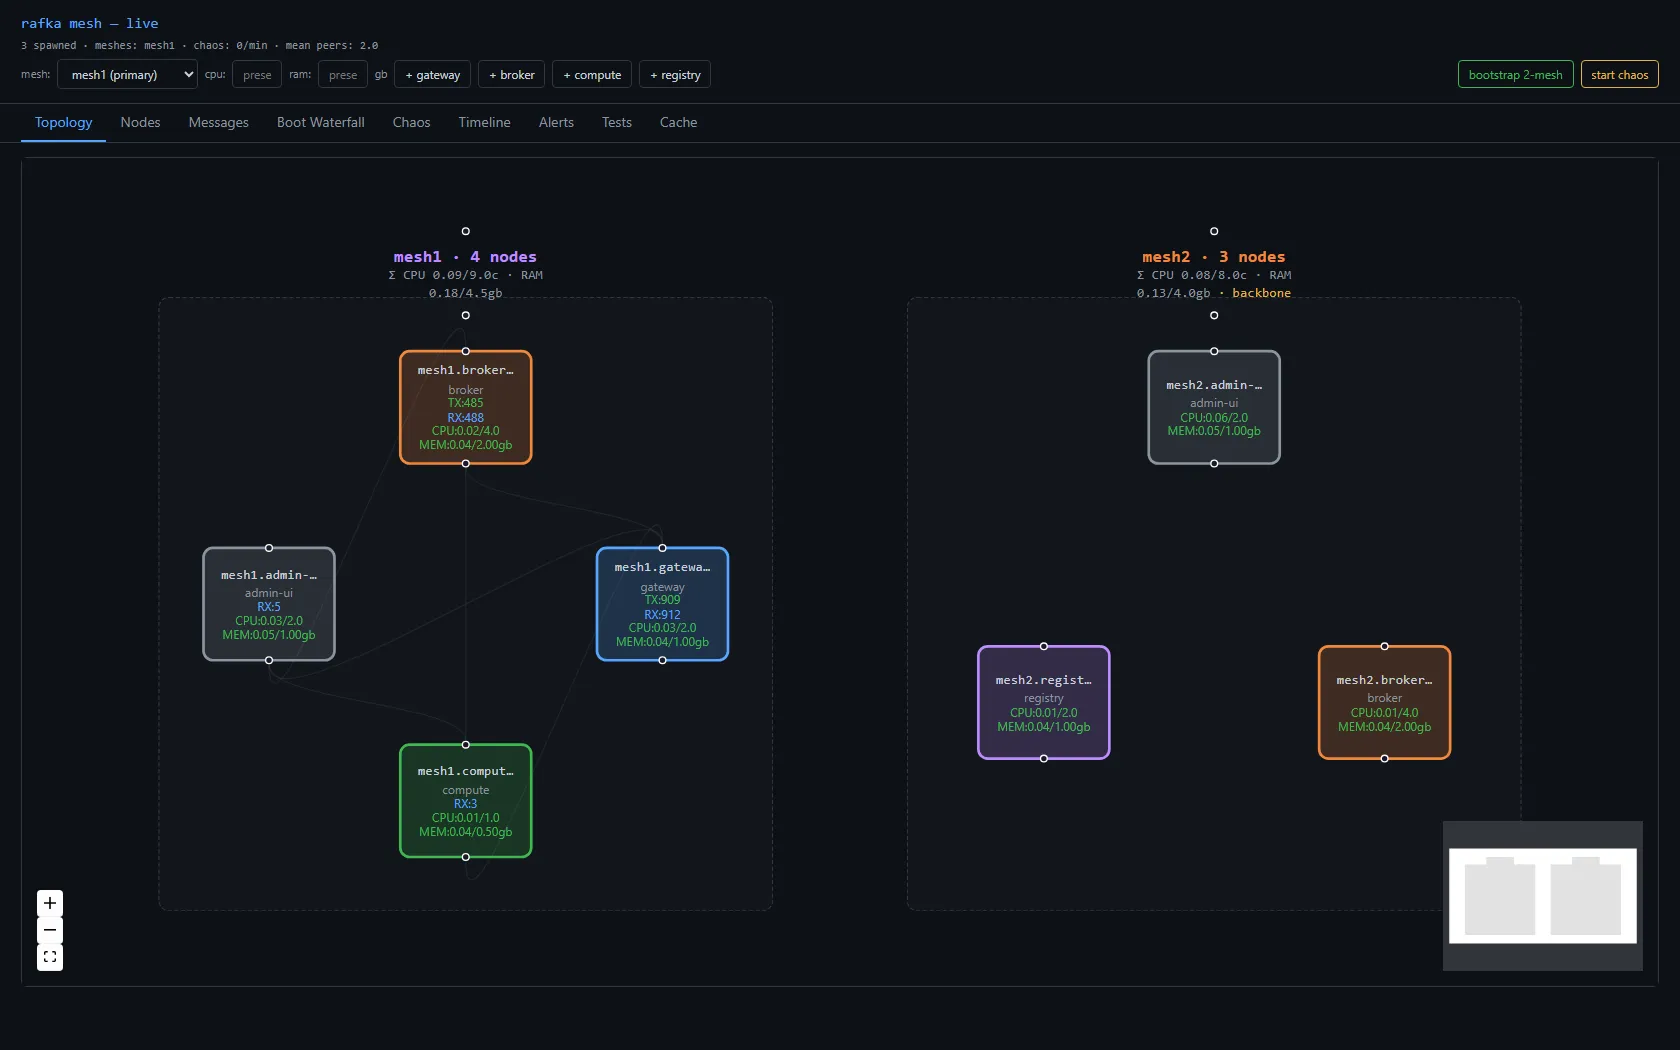
The backbone survives losing its own publisher. The cross-mesh directory is published by one elected node per mesh, on a soft lease. I found the live lease holder by its backbone.published spans, killed it on purpose, and watched the dead-man's-switch do its job: within the lease TTL a different candidate picked up publishing, and the other mesh's console never once lost sight of the first mesh.
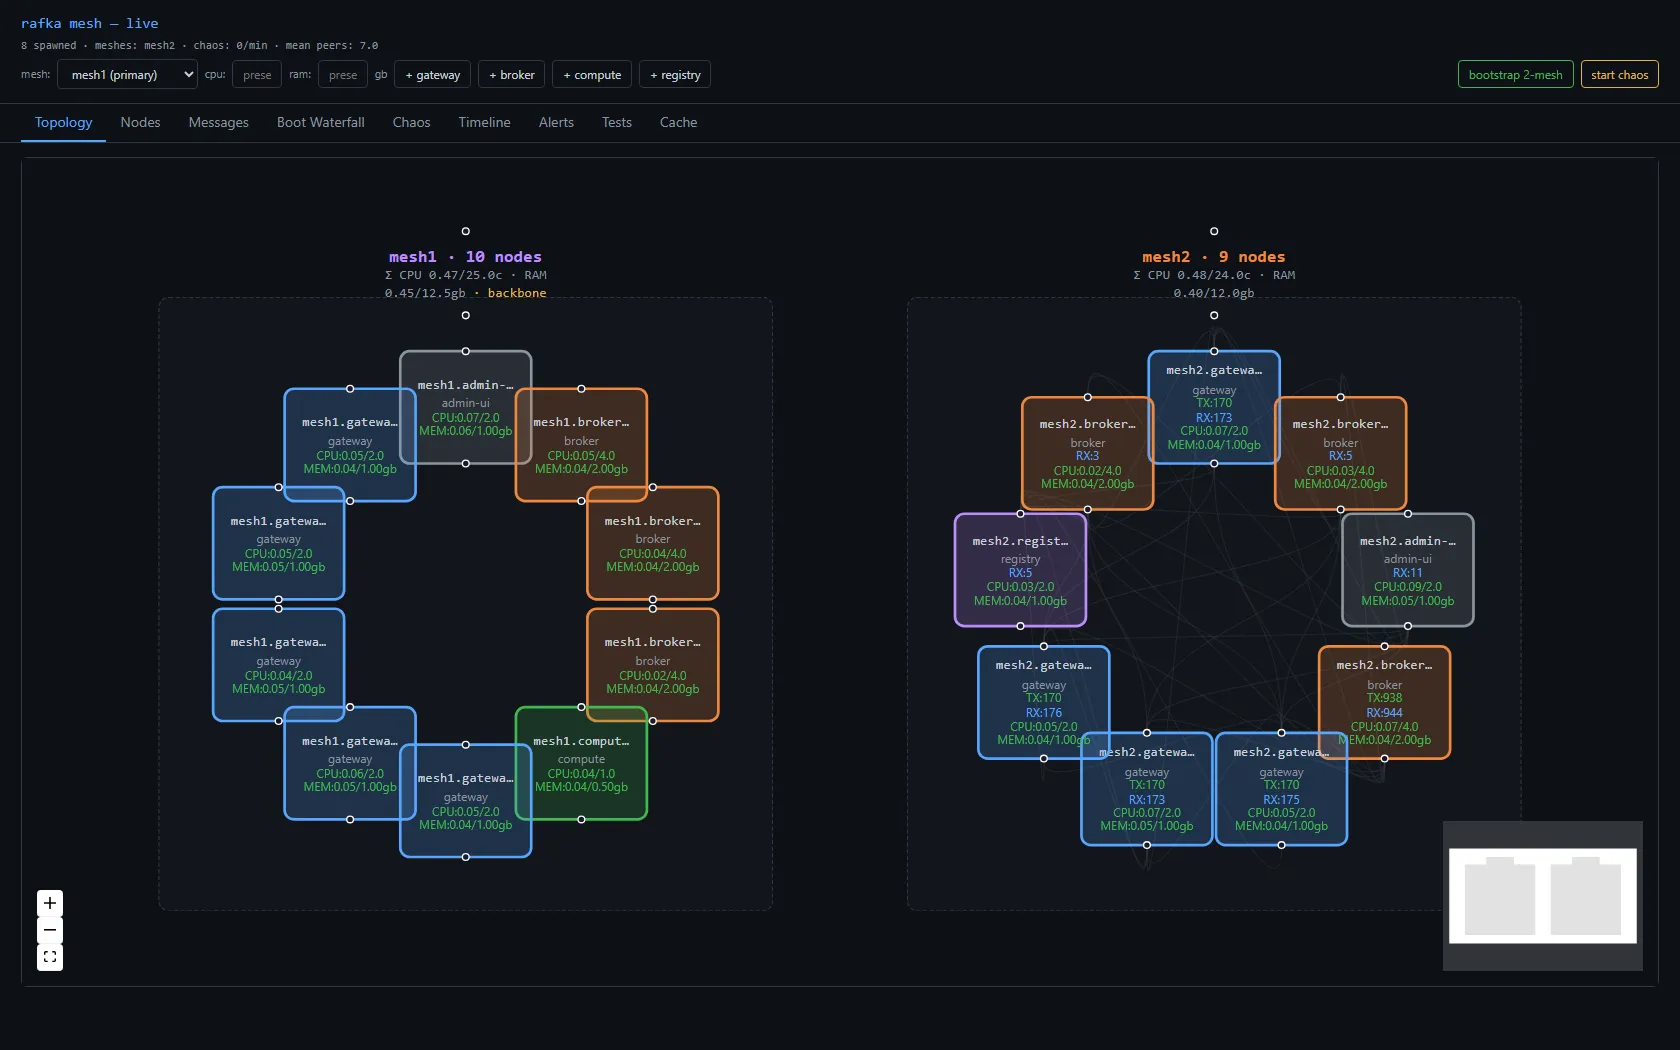
And the two layers I bolted on since aren't scaffolding either. Every node now carries a local cache it owns — and, more importantly, one that forgets dead nodes on the mesh's own clock instead of hoarding ghosts forever — and there's a trust boundary that makes a node prove it belongs at the connection before anyone trusts it with data. So the substrate doesn't just know who's alive; it remembers only what's actually alive, and it stopped letting any random process that can speak the wire wander in. That's not a demo with the safeties off anymore. That's a floor you can stand a product on.
What I'm cheerfully not pretending to have solved
Honesty is the entire job of a post titled "is it ready," so here's the short list of things I'll look you dead in the eye and decline to claim:
- True packet-level partitions — severing a live link while the process stays up — needed firewall control I didn't have in this environment. Process-fault recovery: proven. A network that stays up while lying to you: not yet. I'm not going to insult you by pretending a clean
killis the same thing as a cable that's gone quietly insane. - The relay carrying real traffic in anger — proven in an isolated test, but on a single host the direct path correctly always wins, so right now the relay sits there like a lifeguard at an empty pool. It earns its salary the first time two nodes are in different buildings, and not one second sooner.
- Durability, ordering, backpressure, tenancy — these aren't holes in the substrate. They're the product, and they are quite literally next. Asking the mesh to have solved them already is like yelling at the foundation for not having a kitchen.
The verdict, said like I mean it
Is it ready? Yes — ready to start the actual project: the durable, ordered event-streaming layer this entire substrate was always the excuse to build. Not "ready, with an asterisk and a small prayer." Ready in the specific, bounded, single-host sense I just spent three sections earning the right to say. The basics are iroh'ed out. The boring, load-bearing, terrifying-to-get-wrong part is done — which means the fun part finally starts.
A genuine thank-you to the people behind iroh
Here's the one part of this post I won't be a smartass about, because it's the part that matters most.
None of this — not the gossip membership, not the cross-network relay, not the per-mesh topics, not the QUIC transport that just worked across Windows and Linux without me hand-rolling a single line of NAT traversal — none of it is mine. It rests, entirely, on iroh, built in the open by the team at n0.
Go back and reread this series with that in mind. The clean boot in the first post? iroh endpoints. Two meshes talking with no bridge? iroh-gossip. The relay-as-a-postbox, with a security model I got for free? iroh's relay. When I needed to prove that relay actually carries traffic, I did it with iroh's own built-in test_utils — cross-platform, no custom harness. The 40-second-join bug? The fix was to stop hand-rolling an address book and use the MemoryLookup iroh already shipped. Over and over, the right move turned out to be "the thing iroh already does." That is exactly what a genuinely well-designed library feels like to build on — it keeps quietly steering you away from your own worst instincts.
And when I did find real bugs deep in the stack — a connection leak that took two days to corner — the whole thing being open meant I could read the exact code, prove the fault, and send the fixes back upstream, with a real, responsive community on the other end to catch them. That is not how it goes with a closed black box, where the best you can do is file a ticket into the void and light a candle.
It's easy to forget, in a world of green checkmarks, how much of what we build stands on the quiet, sustained, frequently thankless work of open-source maintainers. We are lucky — genuinely, stupidly lucky — to live in a moment where a small team can hand you a substrate this capable, document it well, answer the issues, and ask for nothing back except that you go build something good with it.
So, to the n0 team — a giant, slightly-too-enthusiastic high-five. Thank you for iroh: for building it in the open, for the care in the API design that kept saving me from myself, and for the relay infrastructure and the test utilities and the docs. You made a genuinely hard problem feel approachable, and you made this whole build log possible.
- iroh — the repo: github.com/n0-computer/iroh
- n0 — the company: n0.computer
- iroh — the project site & docs: iroh.computer
If you build distributed systems, go star the repo, read their docs, and consider supporting the work. The whole ecosystem is better for it — and so is everything I'm about to build on top.