Make the cross-mesh view honest
By the end of the last post there were two meshes and cross-mesh writes. But the moment you opened Jaeger's System Architecture view, it lied to you three different ways. Each lie had a real cause in the spans underneath — and a real fix. Then there was a fourth, structural problem: the way cross-mesh awareness worked didn't scale at all.
Lie 1: "there is one broker"
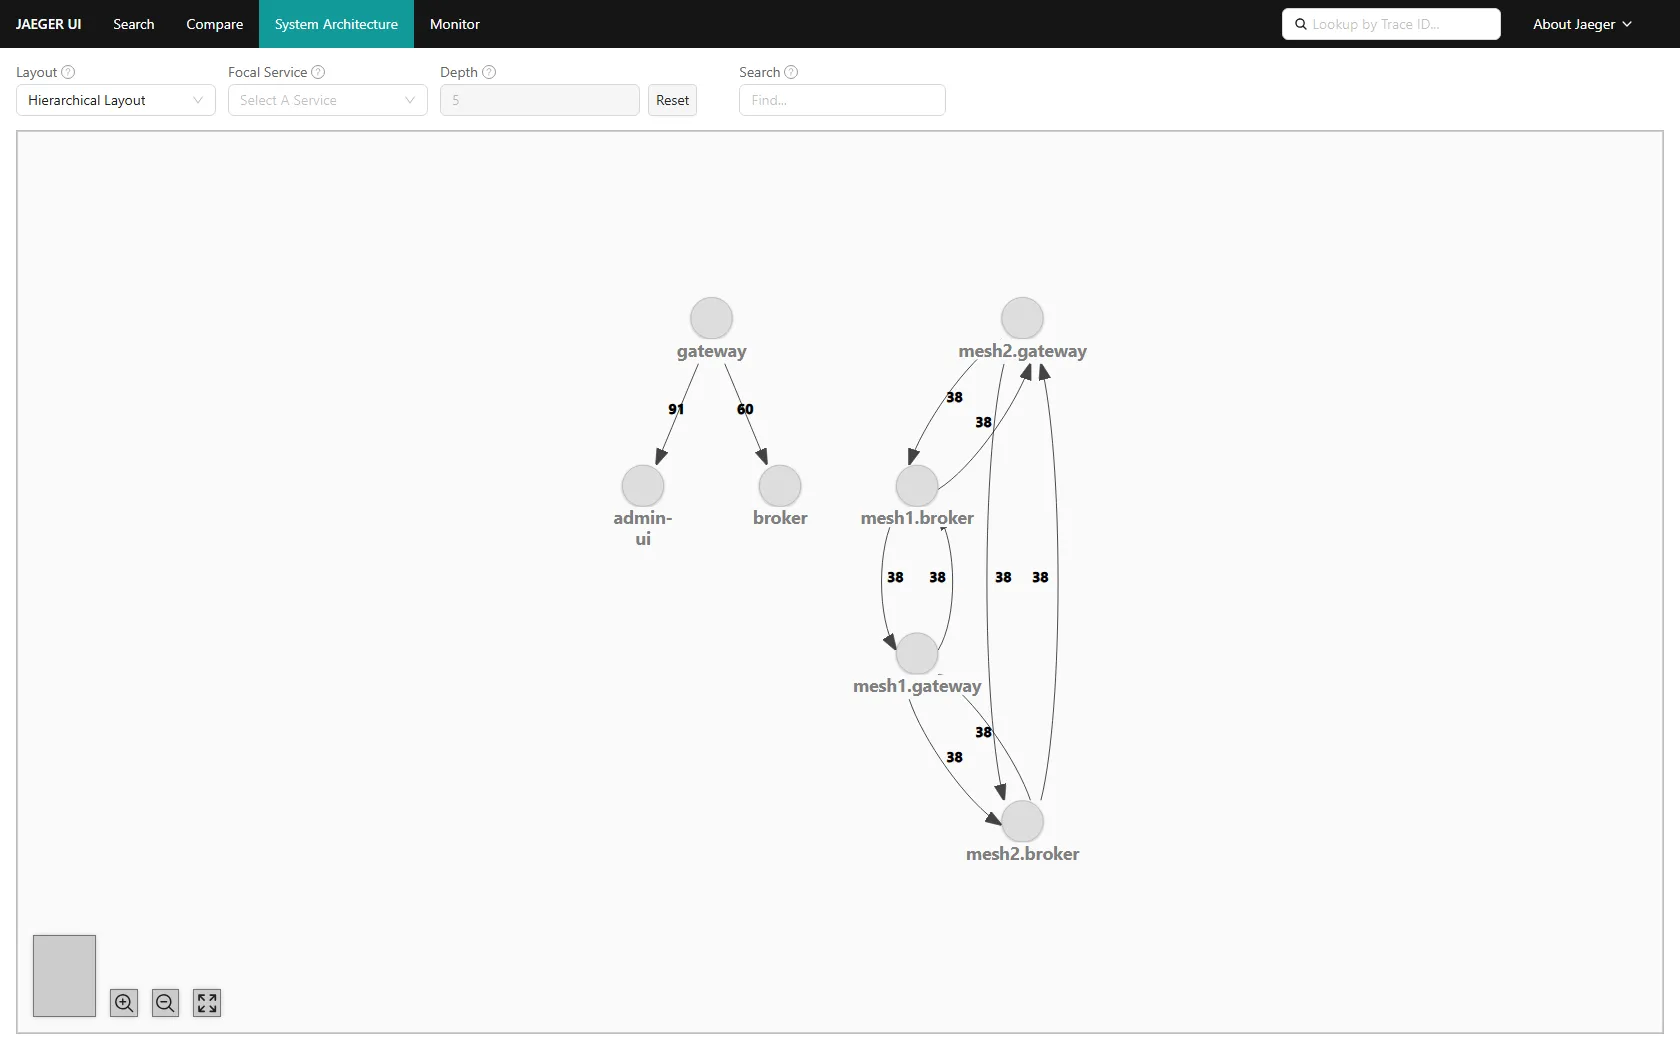
Every broker reported service.name = "broker". Jaeger keys its dependency graph on service name, so mesh1.broker and mesh2.broker collapsed into a single node — and the two-mesh write I'd just shipped was invisible. The fix is the standard OpenTelemetry resource hierarchy, each derived from the node's own identity at boot:
service.namespace= the mesh (mesh1)service.name=<mesh>.<type>(mesh1.broker) — this is what makes a node in the graphservice.instance.id= the full node id (the unique replica)
Suddenly the graph has the nodes that actually exist:
Lie 2: the arrows only point one way
The write was fire-and-forget over a unidirectional stream, so the broker was a pure sink — it received and recorded, but emitted nothing the trace could see. The graph showed gateway → broker and nothing coming back, which isn't what a produce/ack actually is.
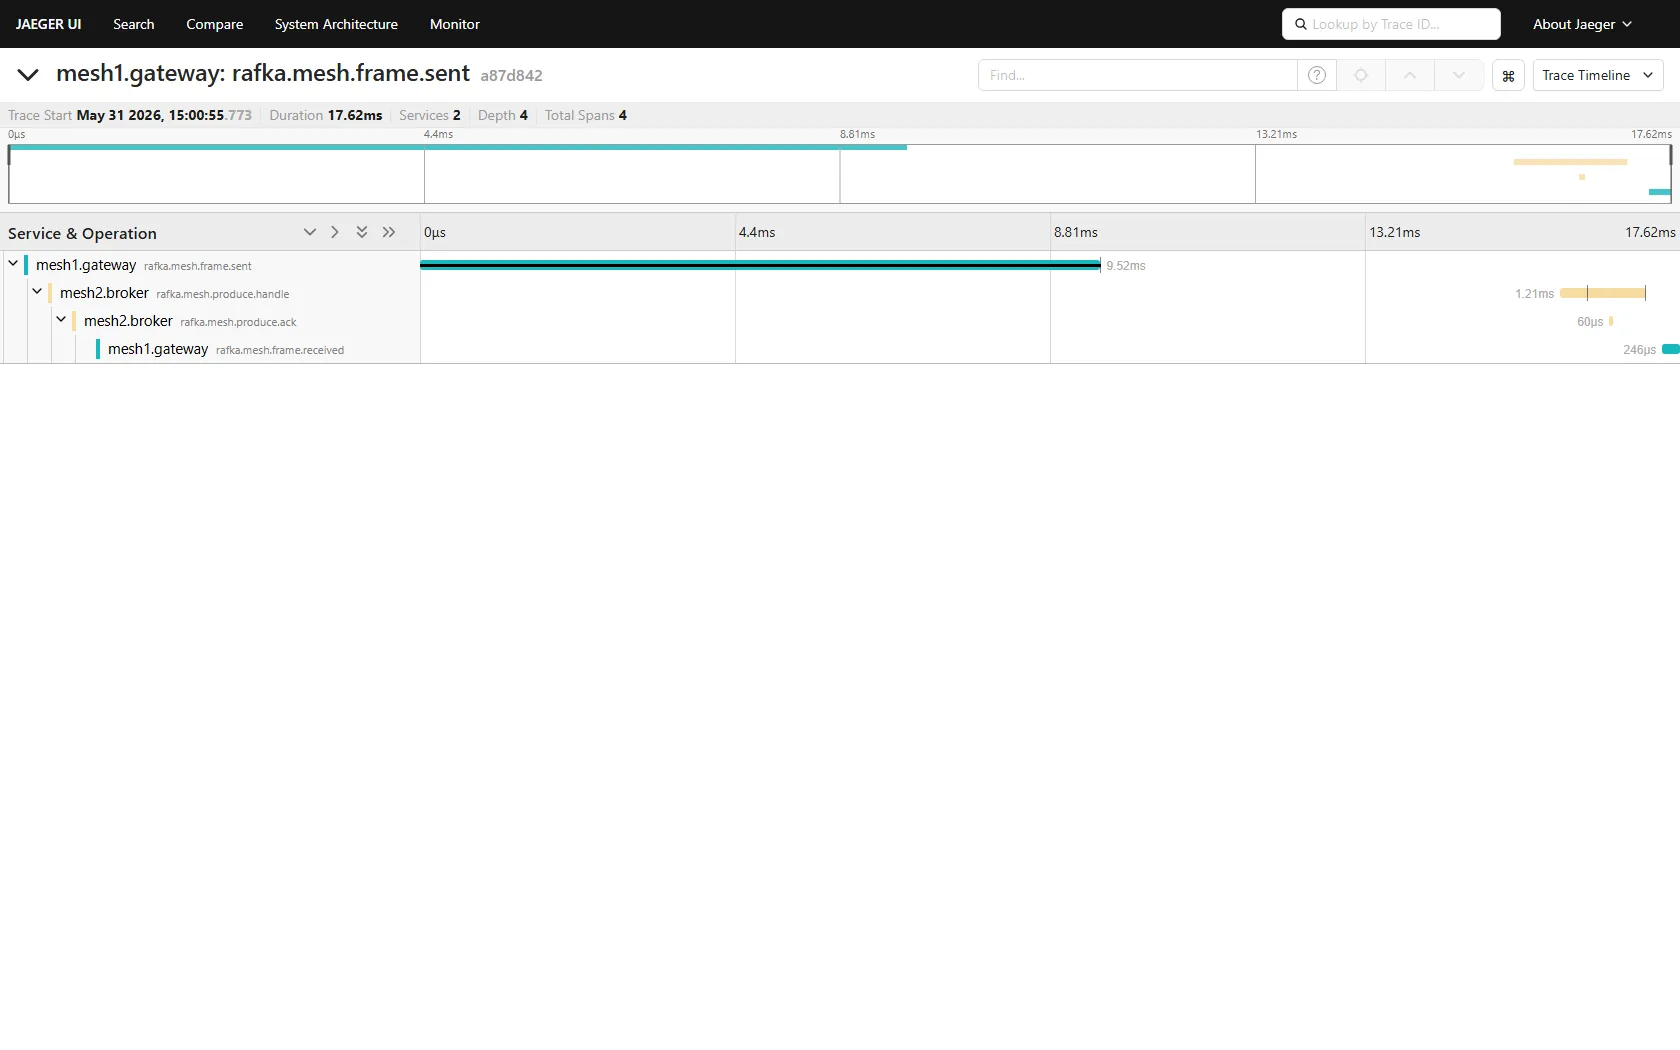
Two fixes, one mechanism. First, propagate real W3C trace context across the QUIC frame — I'd been hand-rolling a {trace_id, span_id, flags} struct that dropped tracestate; now it's the standard traceparent/tracestate carrier via the global propagator. Then the broker continues the trace: it extracts the context, opens its own produce.handle span for its work, and sends an ack back. One cross-mesh trace now reads frame.sent → produce.handle → produce.ack → frame.received — the broker's work is in the trace, and the ack gives the reverse edge. Arrows both ways, because the work genuinely goes both ways.
Lie 3: the gateway "talks to" the console
The graph also showed a fat gateway → admin-ui edge. That wasn't data-plane topology at all — the gateway had been cc'ing a copy of every write to the console so a UI tab would be non-empty. A shortcut to light up a panel, masquerading as real traffic. I deleted the cc; the message view now derives from the per-node frame counters already in the gossip digests — a legitimate observation path — and the console stops appearing as a destination for data it never receives.
The rule under all three: a dependency graph is only as honest as the spans beneath it. Fix the emission, not the picture.
The structural problem: awareness that doesn't scale
The last post ended on a confession — "the gateway subscribes to the other mesh's entire gossip" works on a laptop and falls over everywhere else. With many meshes and hundreds of gateways it's an O(meshes²) firehose of every remote node's per-tick digest. Cross-mesh awareness doesn't need every remote heartbeat; it needs a summary. So split the traffic into three planes, all still just iroh:
| plane | channel | carries |
|---|---|---|
| intra-mesh detail | per-mesh gossip blake3(mesh_id) | full per-node digests (stay local) |
| cross-mesh control | backbone topic blake3("backbone") | one summary per mesh: directory + aggregate metrics |
| cross-mesh data | the relay | the actual write frames, when there's no direct path |
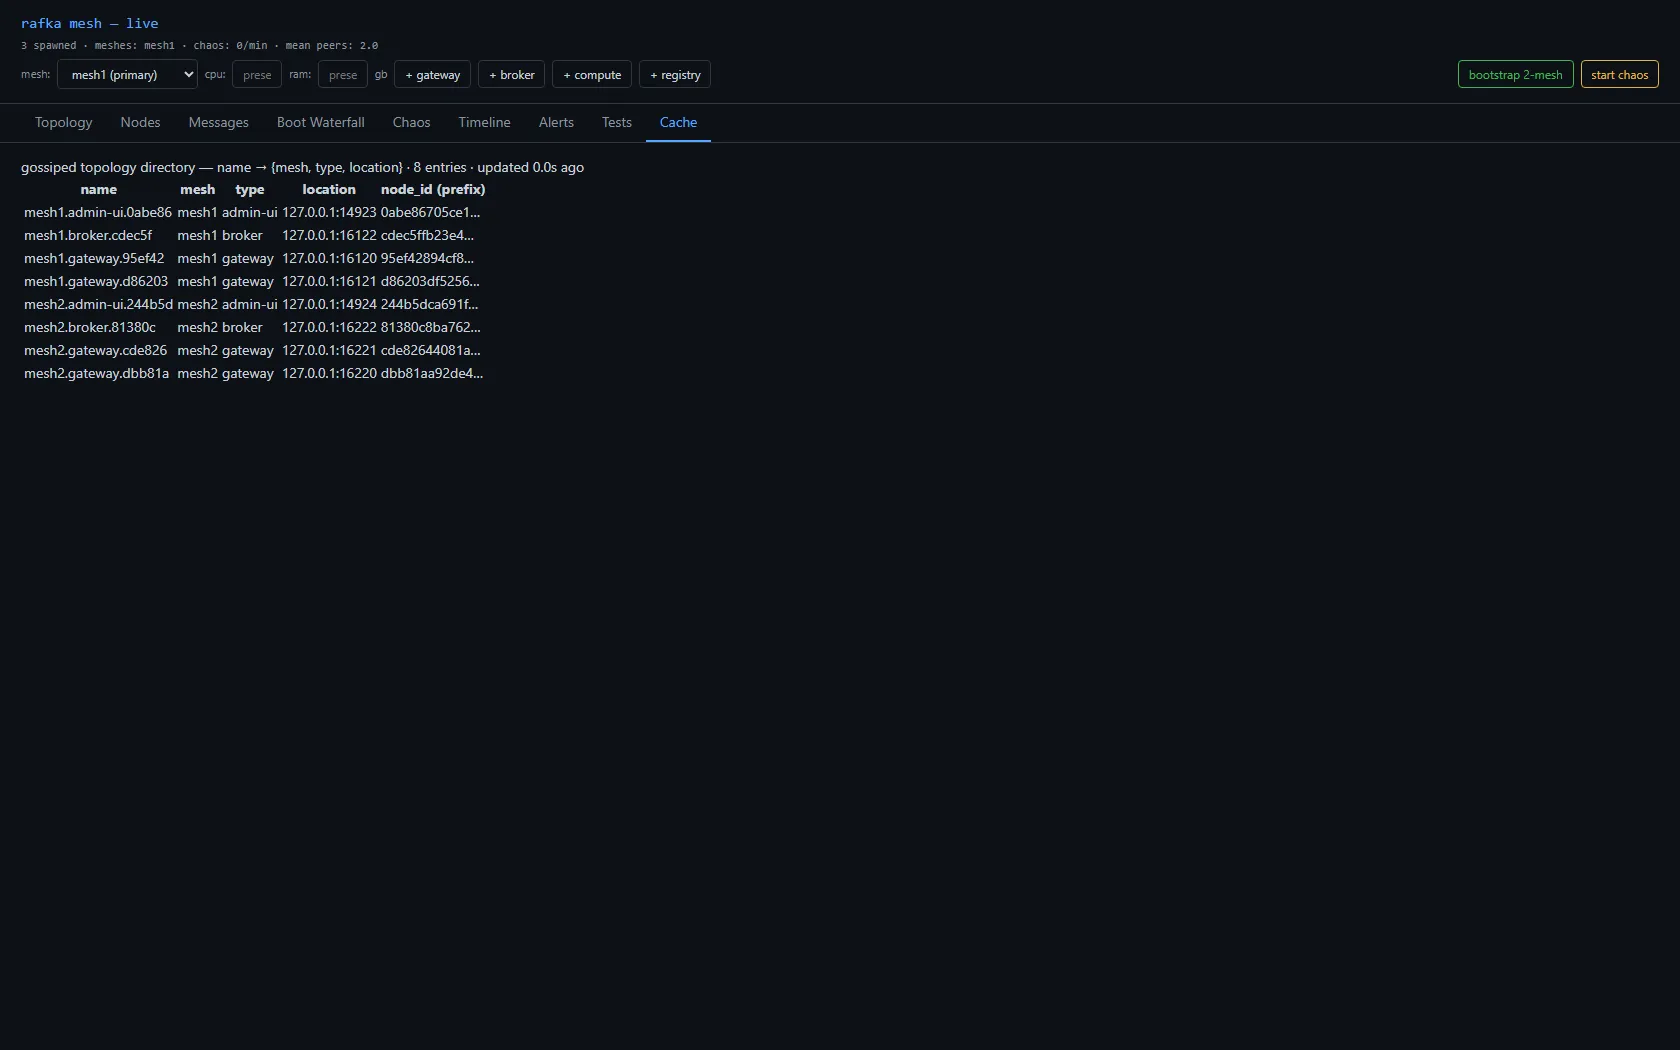
The heavy per-node churn never leaves its mesh. Only a thin rollup crosses. Each mesh's gateway already holds its whole mesh via gossip, so aggregating is a local sum — node count, total CPU/RAM, throughput, plus the name → location directory — published as one MeshSummary to the backbone each interval.
One publisher per mesh — without an election
Hundreds of gateways, but exactly one should publish per mesh. No Raft, no bully algorithm — that would be the bespoke infrastructure I keep refusing to build. Instead, a soft lease carried on the backbone itself: the publisher stamps each summary with published_by + expires_at and renews it; other gateways defer to a live claim and only contend for a vacant seat (lowest node id breaks the tie). Leadership changes only when the publisher dies — its claim expires, the next gateway takes over.
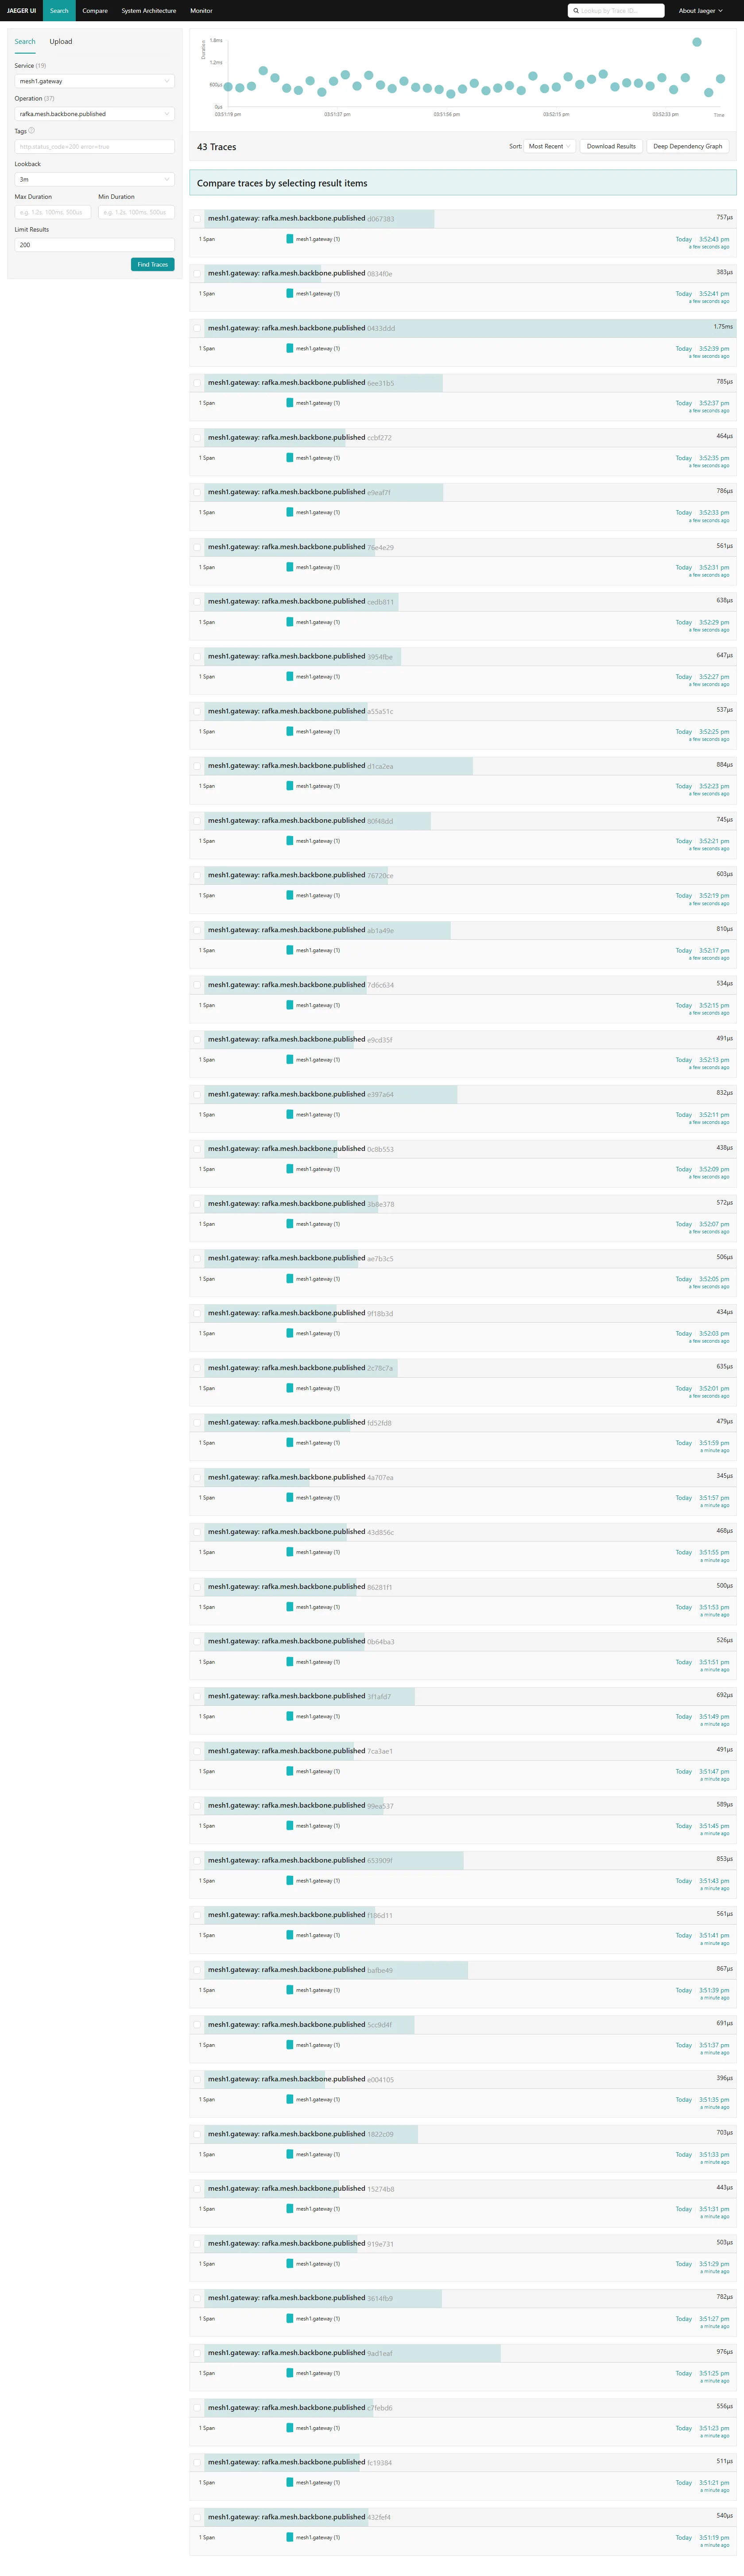
I checked it: across 46 backbone publishes for mesh1 in a 40-minute window, one publisher id. No flapping. The lease holds.
The console becomes a normal node
This is what finally lets the operator console stop being special. It's now a plain node — mesh1.admin-ui.<hex>, a real mesh, self-named — that sees its home mesh in full detail (gossip) and every other mesh as a summary (backbone). Want full per-node detail of another mesh? Run a console in that mesh.
What I'd tell a team
- Trust the graph only as far as the spans earn it. Every lie here looked like a topology bug and was really an emission bug — a coarse service name, a silent sink, a debug cc. Read what your services actually emit before you believe what the dashboard draws.
- Propagate standard context, don't hand-roll it. The home-grown
{trace_id, span_id}struct droppedtracestateand broke continuation.traceparent/tracestatevia the global propagator is five lines and it's correct. - A summary plane beats an all-subscribe firehose. One backbone topic carrying per-mesh rollups, published under a soft lease, replaces O(meshes²) cross-subscription, scales past hundreds of gateways, and removes the last excuse for a "special" node. No DHT, no consensus — one extra gossip topic.