
When 18 nodes pegged my 80-core box at 100%
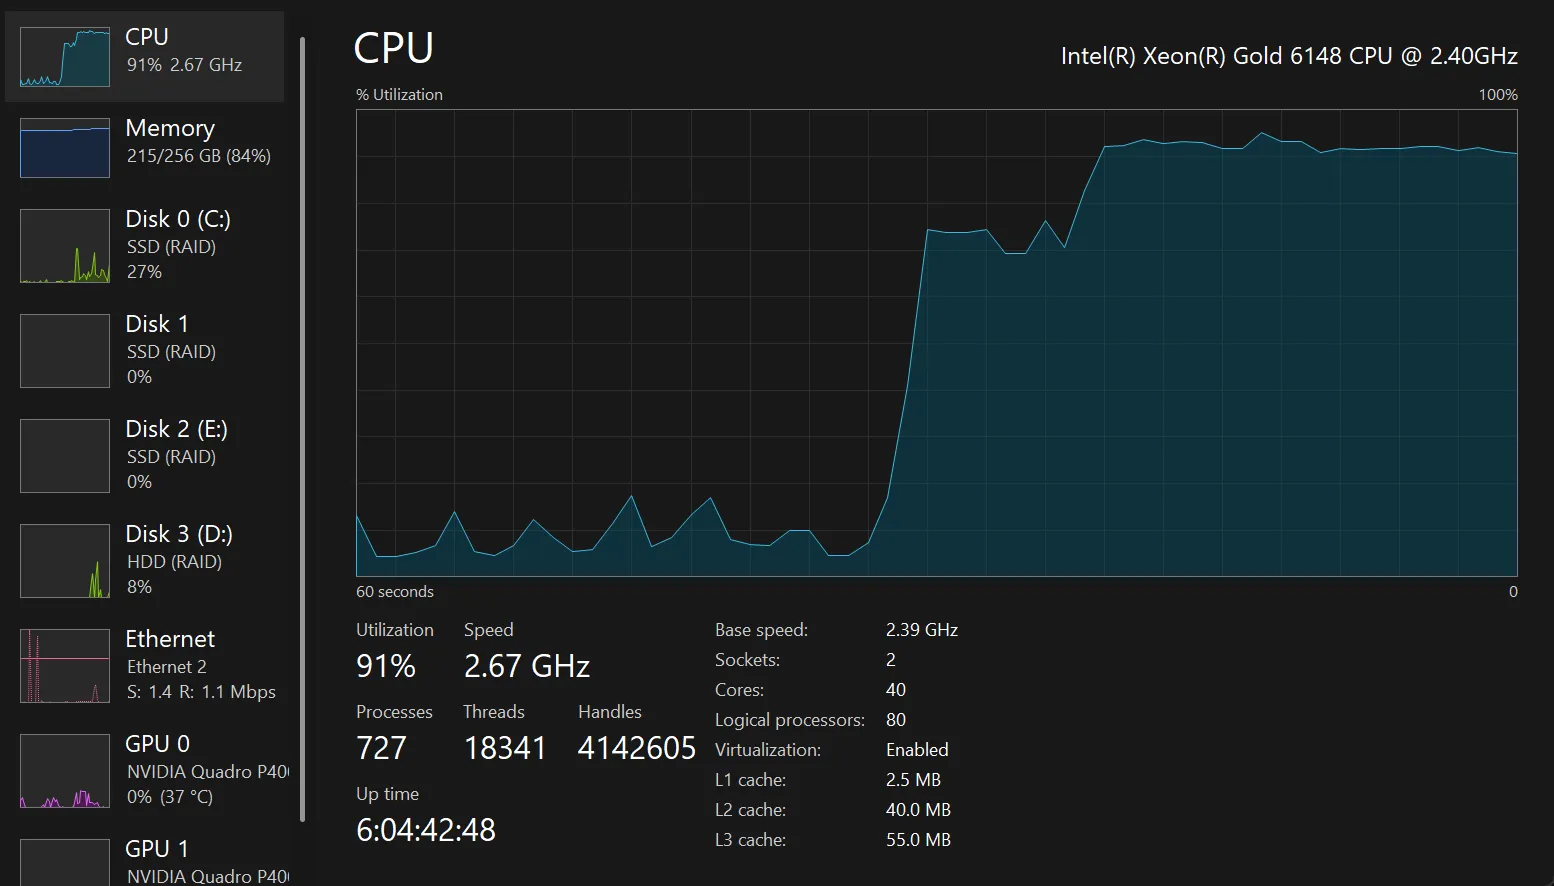
Bootstrapped the cluster. 18 nodes — two of each role per mesh, across two meshes, with two bridges. Hit Bootstrap at 14:51 local. Host CPU at 14:52 was 100% across all 80 logical cores. Five samples a second apart, all 100%.
The mesh worked. /api/topology came back with 19/19 live (the admin-ui plus 18 children). Each node's GossipDigest was arriving. The Topology view in the dashboard painted. Bytes were moving. Nothing was crashing.
It was just consuming the entire machine to do that.
What the first reading said
I'd expected ~10% host load. The two Xeon Gold 6148s in this box are not a small machine — 80 logical processors, hyperthreaded across two sockets. A handful of small Rust processes broadcasting 200-byte digests every 500ms should not be pegging the entire system. My mental model of "iroh-gossip at 18 nodes" was Bitcoin-territory: single-digit % per node.
The actual reading per-process via Task Manager:
| Node | CPU % | What I expected |
|---|---|---|
mesh-broker.exe × 4 | 0.66–1.52 each | ~0.05 |
mesh-gateway.exe × 4 | 0.72–1.32 each | ~0.05 |
mesh-compute.exe × 4 | 0.67–0.86 each | ~0.05 |
mesh-registry.exe × 4 | 0.63–1.80 each | ~0.05 |
mesh-bridge.exe × 2 | 0.82–0.83 each | ~0.05 |
mesh-admin-ui.exe × 1 | 3.44 | ~1.0 |
Add the column up: ~18% of the 80-logical box, before counting iroh-quinn's kernel-side work. Performance Monitor's \Processor(_Total)\% Processor Time showed 95–100% sustained. Something else was eating the headroom.
The shape of the cost — every process burning roughly the same amount regardless of how many peers it had — pointed at per-tick work rather than per-peer work. So I started with three suspects that fire on a clock.
Three obvious things to try
1. Turn off mDNS
iroh-mdns was discovering every node on the local network and adding it to the active peer set. On a single box, that means 17 mDNS-announced peers per node — each one getting a QUIC handshake, each one getting added to HyParView's active view (which should be ~5, not 17). I had a hunch that the cluster was forming a full mesh rather than a sparse spanning tree.
MESH_MDNS_ENABLE=false, with explicit seed nodes injected at spawn time (admin-ui as the universal seed, plus 1–2 already-spawned same-mesh peers). Each child boots, dials its seeds, and lets HyParView shape the rest from there.
2. Slow the gossip cadence
MESH_GOSSIP_INTERVAL_MS was 500. At 18 nodes that's 36 broadcasts/sec across the cluster. For a control-plane heartbeat, that's overkill — Kafka's KRaft heartbeats every 1–3 seconds and considers a broker dead after 9 missed cycles. There's no reason substrate health needs 2 Hz granularity.
Bumped to 2000ms. 9 broadcasts/sec cluster-wide. Plumtree's IHAVE retransmits handle any actual loss.
3. Demote per-frame INFO spans to TRACE
This one I caught by reading the stdout. Every received gossip digest fired a tracing::info_span!("mesh.gossip.received", ...). With Plumtree's eager-push fanout, each digest arrives at a node ~17 times (once per peer in the active view, before lazy IHAVE deduplicates). At 36 broadcasts/sec × 17 fanout × N nodes, the cluster was producing ~2,600 INFO-level events per second.
Each event goes through tracing-subscriber's formatter (stdout write), then tracing-opentelemetry's layer (build a protobuf span, push to the OTLP batch queue, eventually send to Jaeger over gRPC). That's not free.
INFO is for state transitions — peer connected, peer disconnected, gossip topic subscribed. Per-frame events should be TRACE so they're filtered before any of that fires.
// before
tracing::info_span!("mesh.gossip.received", ...)
    .in_scope(|| info!(...));

// after
tracing::trace_span!("mesh.gossip.received", ...)
    .in_scope(|| tracing::trace!(...));
The reading after
Host CPU dropped from 100% to ~35%. Per-node CPU dropped from 0.5–1.5 cores down to roughly 0.25 cores. The log volume cratered — admin-ui's stdout went from 261,000 lines in 50 seconds to about 41,000.
That's a real improvement. It's also still wrong. A self-organizing P2P mesh of 18 idle nodes should not be using a quarter of a logical core per node. Bitcoin nodes idle at single-digit percent of one core, not 25% of one.
The hypothesis I started forming: "iroh-gossip itself is just expensive at this scale, the architecture is wrong, we should pivot to a centralized Controller." I spent two days seriously sketching the Controller architecture — a single coordinator, every node holds one connection to it, hub-and-spoke at the protocol layer. It would have worked. It would have been a much bigger change.
Before I committed to it, I decided to flamegraph the running cluster first.
That's the next post.
What I'd tell a team
- Symptoms that look like "X is fundamentally too expensive" usually aren't. They're usually "you're doing X on a faster clock than you measured." Slow the clock before you blame the protocol.
- Comment the cadence on every periodic loop. The 500ms gossip interval was a placeholder I never revisited. A code comment claiming "// every 500ms is fine, gossip is cheap" would have been a lie regardless of intent. Better: don't claim it's fine, claim what you measured.
- INFO is for state transitions. TRACE is for per-frame events. DEBUG is for the boundary between those two — "useful when investigating, noisy in steady state." If you can't draw the line cleanly, your spans are doing too much.
What's next
The 35% reading was the trap. It looked like I was making progress, and it was real progress — but it convinced me the remaining cost was structural rather than a bug. The next post is the flamegraph that showed me how wrong I was, and the one-line fix that took the cluster from 35% to 5%.