
Four days into the soak, the RAM was still climbing
After the join_peers storm fix the canary settled. Host CPU 6%, per-node CPU 0.05–0.10 cores, mesh stable, 19/19 live. I left it running overnight, expecting to come back to roughly the same numbers in the morning.
It came back to 100%.
Five days later, with the soak still going on the same processes, the numbers looked like this:
| Metric | t=0 fresh | t+32min | t+105h (now) |
|---|---|---|---|
| Total CPU (sysinfo sum) | 1.38 cores | 2.59 cores | 14.90 cores |
| Total RAM | 1.04 gb | 1.32 gb | 11.87 gb |
| Per-node avg CPU | 0.077 | 0.144 | 0.83 |
The previous post celebrated 0.05–0.10 cores per node. Four days later the average was 0.83. Eleven times worse. The cluster wasn't crashing; it was eroding.
The fingerprint that didn't fit
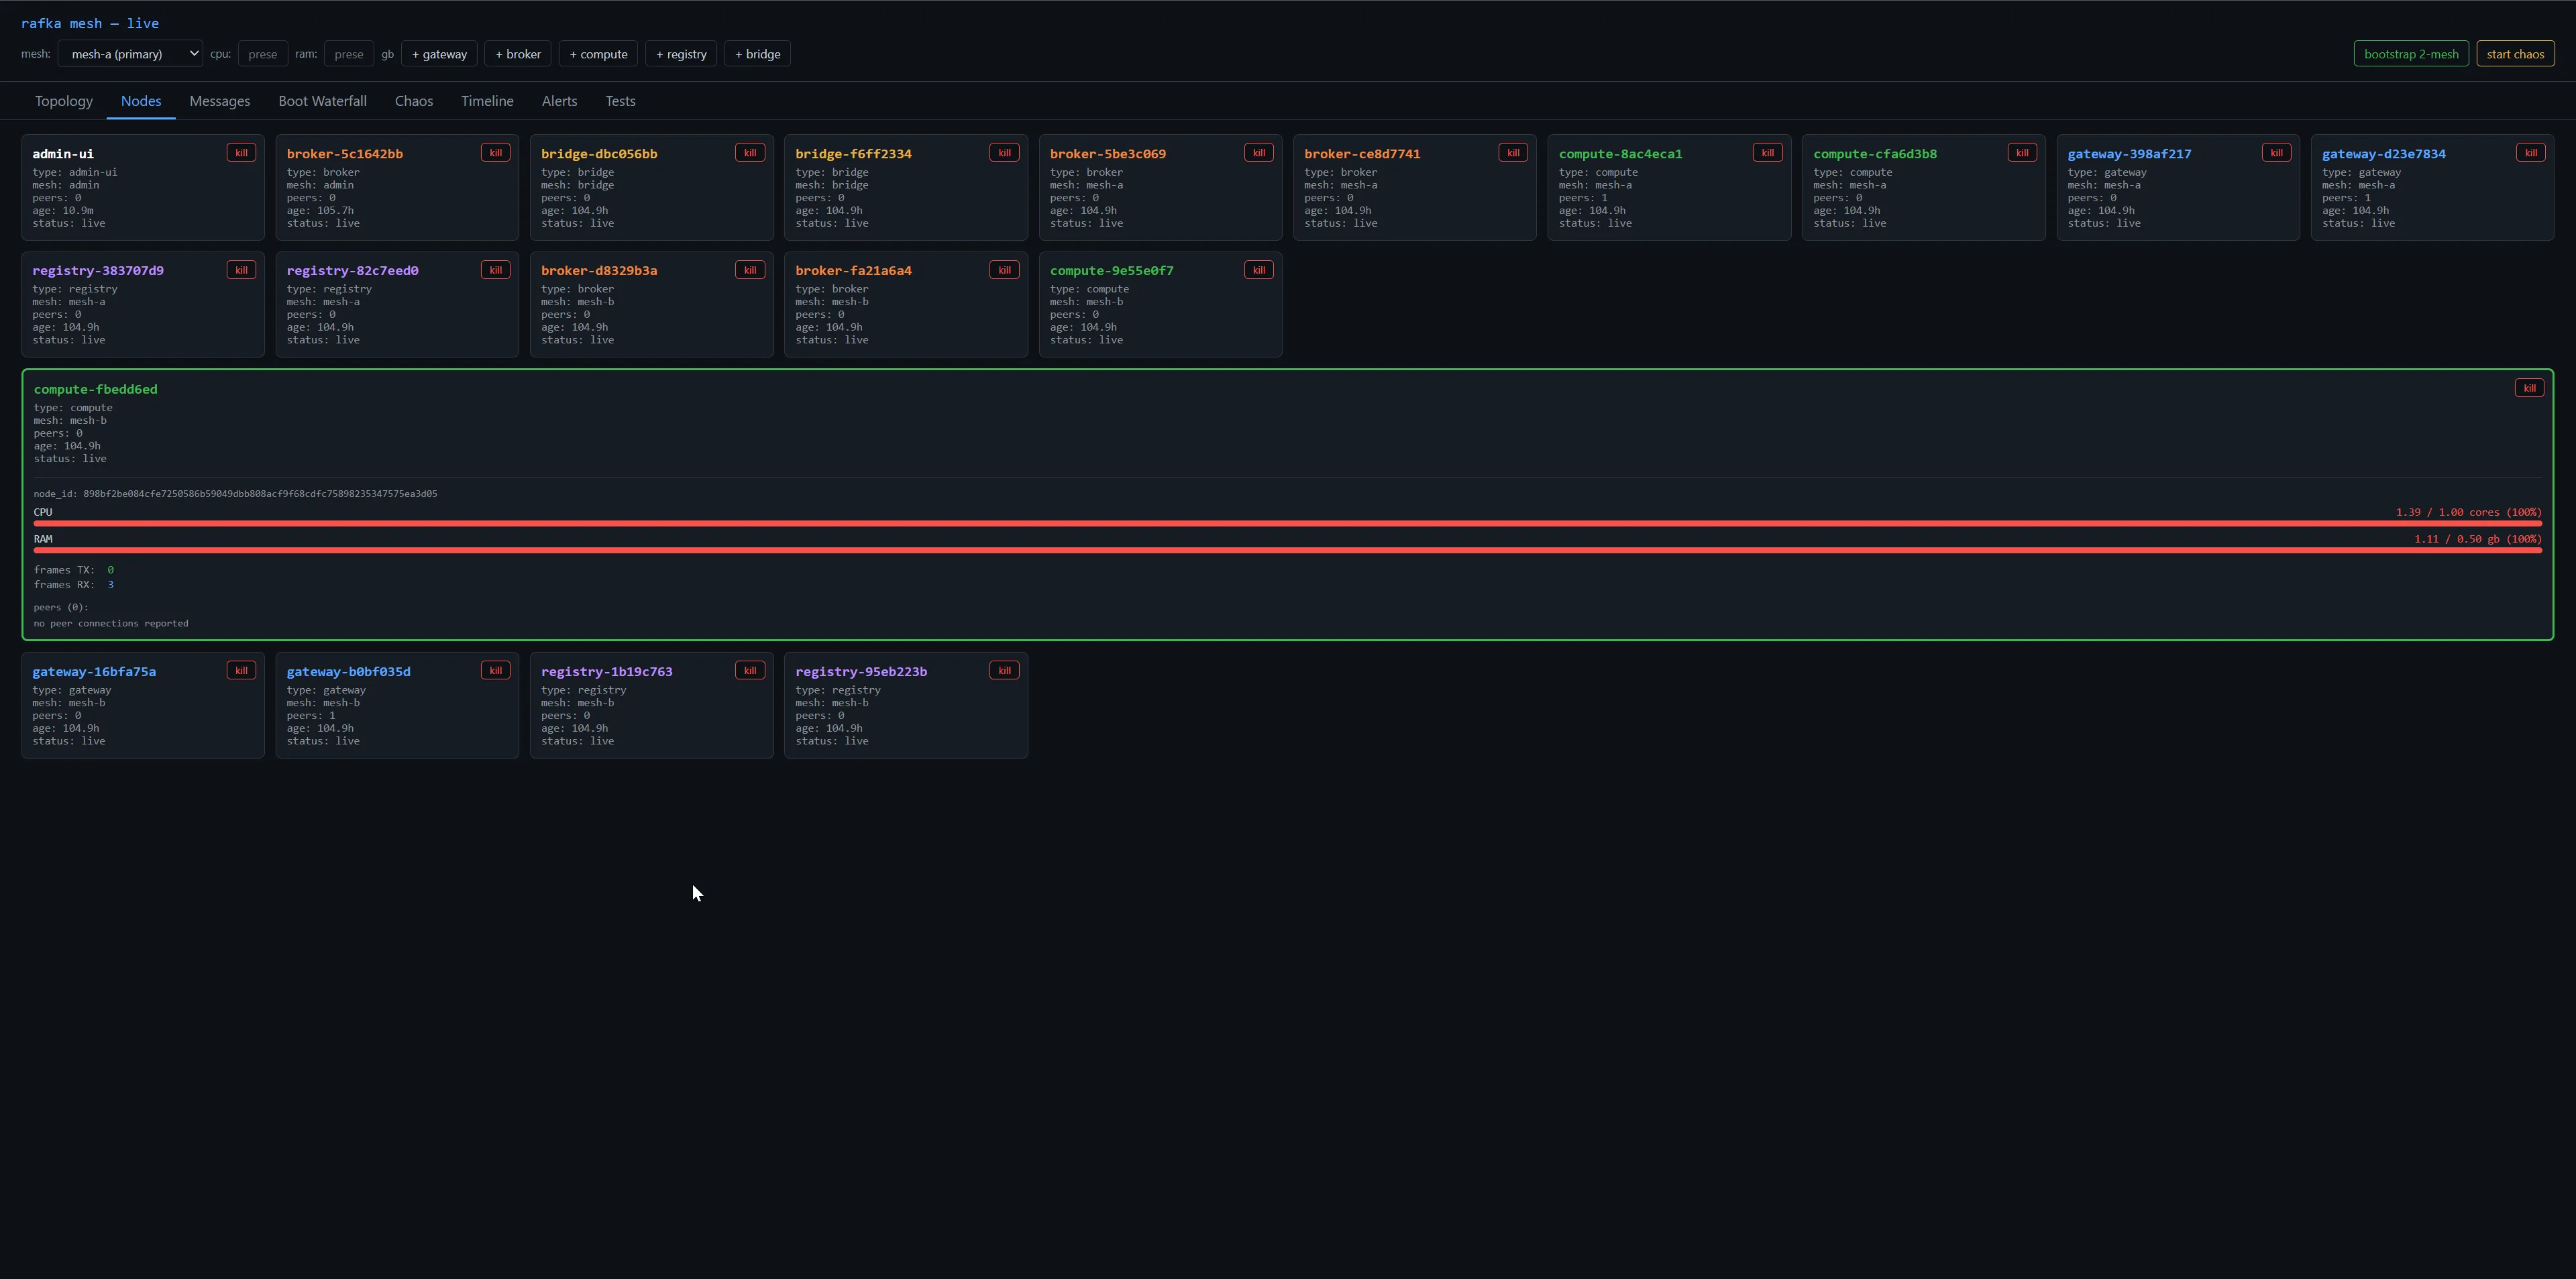
The shape of the cost was the giveaway. Looking at top consumers after four days:
| Node | Peers | CPU | RAM |
|---|---|---|---|
compute-8ac4eca1 | 1 | 2.57 cores | 2.35 gb |
gateway-16bfa75a | 0 | 1.88 cores | 1.64 gb |
compute-fbedd6ed | 0 | 1.39 cores | 1.11 gb |
broker-d8329b3a | 0 | 0.94 cores | 0.64 gb |
The nodes burning the most CPU had zero peers. That's a contradiction in a healthy mesh — a node with no peer connections should be idle. Either the work isn't happening on connections at all, or the connections aren't being counted right.
Both turned out to be true. The work was happening on connections the peer count didn't know about — closed-but-not-cleaned Connection handles still pinned by background tasks — and on global maps that had been growing for 105 hours without anyone telling them to shrink.
Five leaks, in order of impact
1. Ghost QUIC connections on peer reconnect
iroh-quinn allows multiple parallel connections from the same identity. When the same peer reconnects after a network blip, the application sees a new Connection; the old one just sits there alive until something explicitly closes it. The accept loop was doing this:
reg.insert(peer_id.clone(), conn.clone());      // overwrites registry
tokio::spawn(run_bi_echo_reader(conn_bi));      // holds clone of new conn
run_frame_reader(/* ... */, conn /* moved */);  // holds new conn
What it never did was close the previous Connection before overwriting the entry. The old run_frame_reader task was still parked on accept_uni() of the old conn, which would never error because the old conn was never closed. Same with run_bi_echo_reader and accept_bi(). They sat there forever, holding Connection clones and keeping iroh-quinn's per-connection state (congestion controller, TLS session, packet pacer) live.
Fix:
if let Some((_, old_conn)) = reg.remove(&peer_id) {
    old_conn.close(0u32.into(), b"superseded by new connection");
}
reg.insert(peer_id.clone(), conn.clone());
Connection::close causes both accept_uni and accept_bi on the old conn to return Err, the old tasks break out cleanly, the iroh-quinn state drops.
2. live_digests and topic_membership grow forever
Two process-global DashMaps. live_digests is keyed by node_id with the latest GossipDigest received from that node. topic_membership is keyed by topic-label with a set of node_ids ever seen on that topic. Both are populated on every received digest. Neither had a pruning mechanism.
Every cluster respawn (and there had been many over the week of debugging) added entries with new node_ids — admin-ui pre-mints a fresh keypair per spawn, so every restart creates a new identity. Old identities never broadcast again. Their entries stay forever.
Fix: a single background task on a 5-second timer that scans live_digests, drops entries whose wall_time_ms is older than MESH_STALENESS_MS (default 30 seconds), then removes those node_ids from every topic's membership set.
async fn run_staleness_pruner() {
    let staleness_ms: u64 = std::env::var("MESH_STALENESS_MS")
        .ok().and_then(|s| s.parse().ok()).unwrap_or(30_000);
    let mut tick = tokio::time::interval(Duration::from_millis(5_000));
    loop {
        tick.tick().await;
        let now_ms = SystemTime::now()
            .duration_since(UNIX_EPOCH).map(|d| d.as_millis() as u64).unwrap_or(0);
        let stale: Vec<String> = live_digests().iter()
            .filter(|e| now_ms.saturating_sub(e.value().wall_time_ms) > staleness_ms)
            .map(|e| e.key().clone()).collect();
        for node_id in &stale {
            live_digests().remove(node_id);
        }
        for mut topic_entry in topic_membership().iter_mut() {
            for node_id in &stale {
                topic_entry.value_mut().remove(node_id);
            }
        }
    }
}
The self-injection on each node's gossip emit refreshes its own wall_time_ms, so a live node's entry never goes stale.
3. mesh_id_registry never pruned
Parallel to the peer PeerRegistry, there's a mesh_id_registry: DashMap<String, String> that maps peer_id → peer_mesh_id, populated from Hello frames so bridges can know which mesh a peer belongs to. The disconnect handler removed the peer from PeerRegistry but left the entry in mesh_id_registry. Over the soak, that map grew with every peer ever seen.
One-line fix in the existing disconnect handler:
Err(_) => {
    registry.remove(&peer_id_str);
    mesh_id_registry.remove(&peer_id_str);  // added this
    // ...
}
4. joined_peers HashSet only ever inserted
The fix from the previous post — joined_peers to dedupe join_peers calls — was correct, but I never made it shrink. If a peer disconnects, its entry in PeerRegistry is gone, but its entry in joined_peers lingers. On reconnect, the new connection wouldn't get join_peers called for it, because the old entry was still there.
joined_peers.retain(|p| registry.contains_key(p)) on every tick. Self-trimming.
5. dial_seeds one-shot, no retry
Not a leak per se but discovered during the same audit. dial_seeds did a single endpoint.connect() per seed at boot. If the seed wasn't up yet (race during cluster bootstrap), the child was permanently isolated — no retry, no fallback. Replaced with per-seed tokio tasks doing exponential-backoff retry: 1s, 2s, 4s, 8s, 16s, capped at 30s, max 10 attempts. Spans mesh.seed.retry and mesh.seed.giveup are emitted at INFO so seed-side issues are visible in Jaeger.
What I'd tell a team
- Soak the substrate before you trust it. A 30-second canary won't catch slow leaks. Five minutes won't either. The bugs in this post took 4 days to surface in a meaningful way. If your substrate matters, leave it running overnight before you ship anything on top of it.
- Process-global state needs an owner. Every
DashMapthat lives for the process lifetime needs a clear answer to "what removes entries from this?" If the answer is "nothing, the process restarts and it's fine" — that's a hidden cluster-restart dependency. Add a pruner. - Closed channels and overwritten registry entries are not free. The
tokio::select!continueon a closed channel that spins a core, theDashMap::insertover an existing key whose value held resources — both compile, both look fine in review, both cost you real CPU and memory. When you find yourself overwriting a key whose previous value held something withDropsemantics (aConnection, aJoinHandle, aFile), explicitly handle the old value. - The fingerprint matters. Top CPU consumers having zero peers was the clue. It told me the problem couldn't be peer-count-dependent — it had to be time-dependent and stateful. That narrowed the search from "anywhere in the gossip protocol" to "what state grows when we lose connections."
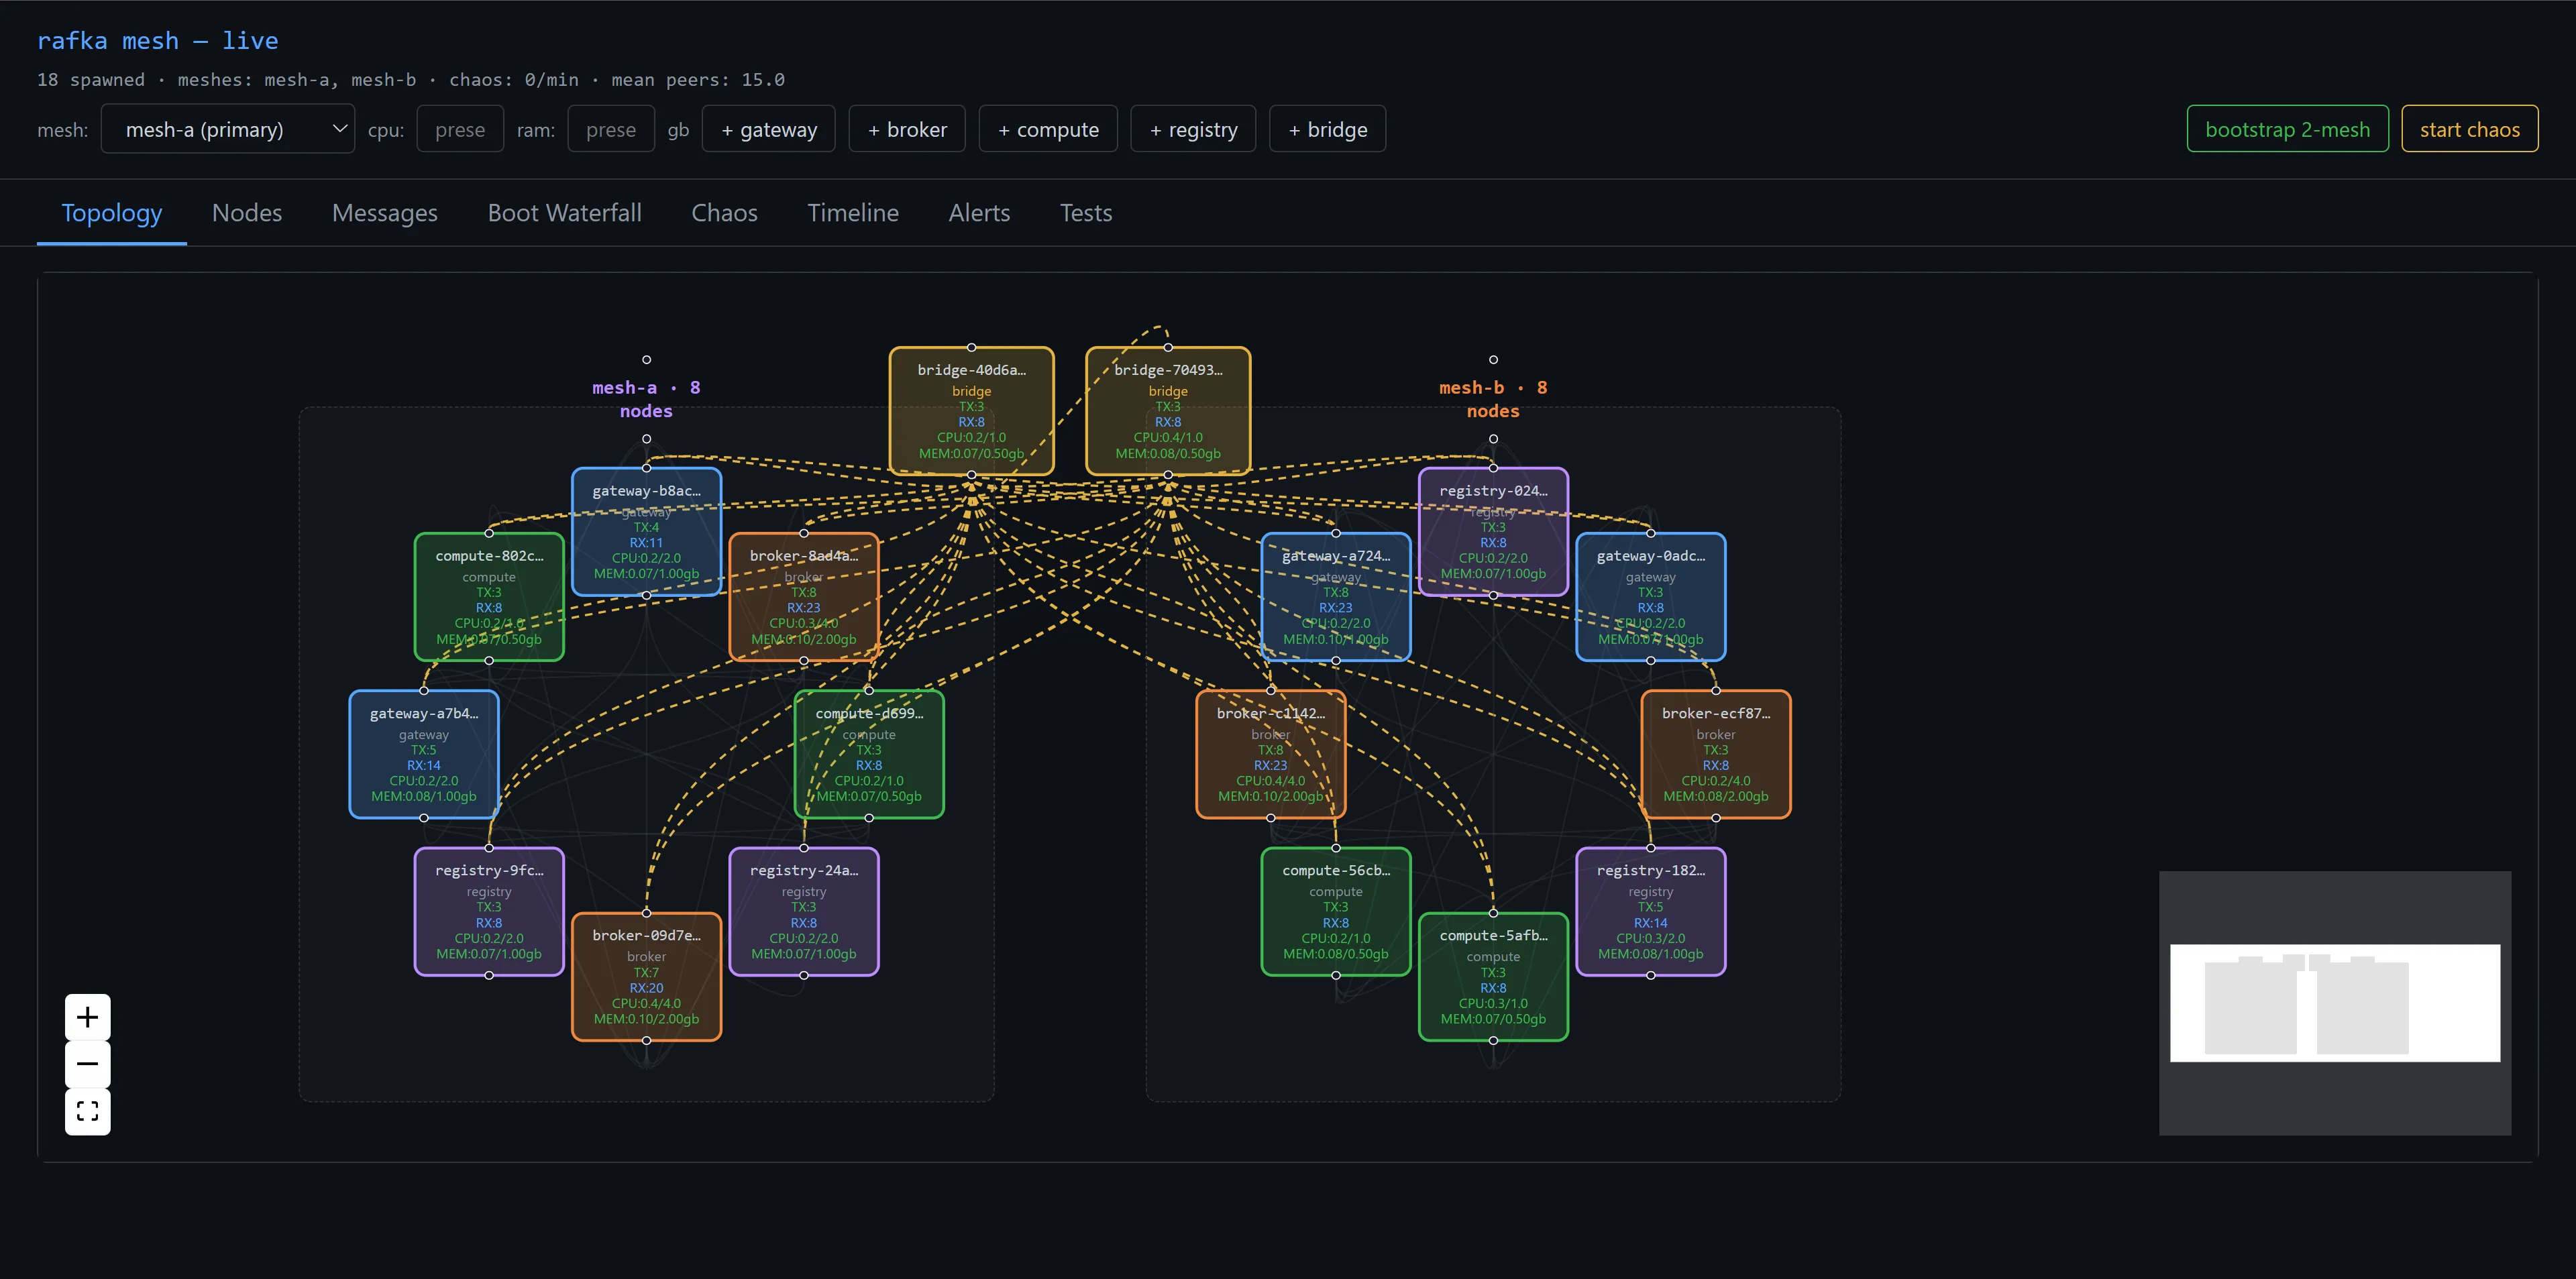
After the five fixes landed I started another soak, this time with the new pruner emitting mesh.staleness.pruned spans every 5 seconds and a 30s MESH_STALENESS_MS window. The topology view stayed populated with real values rather than ghost entries:
What's next
Steady-state works. The next question is what happens under load that isn't steady — when nodes die, when links flap, when clocks drift. The chaos battery I built for Sprint 02 has been sitting unused while the CPU work happened. Next week I unleash it on the substrate I just got working.